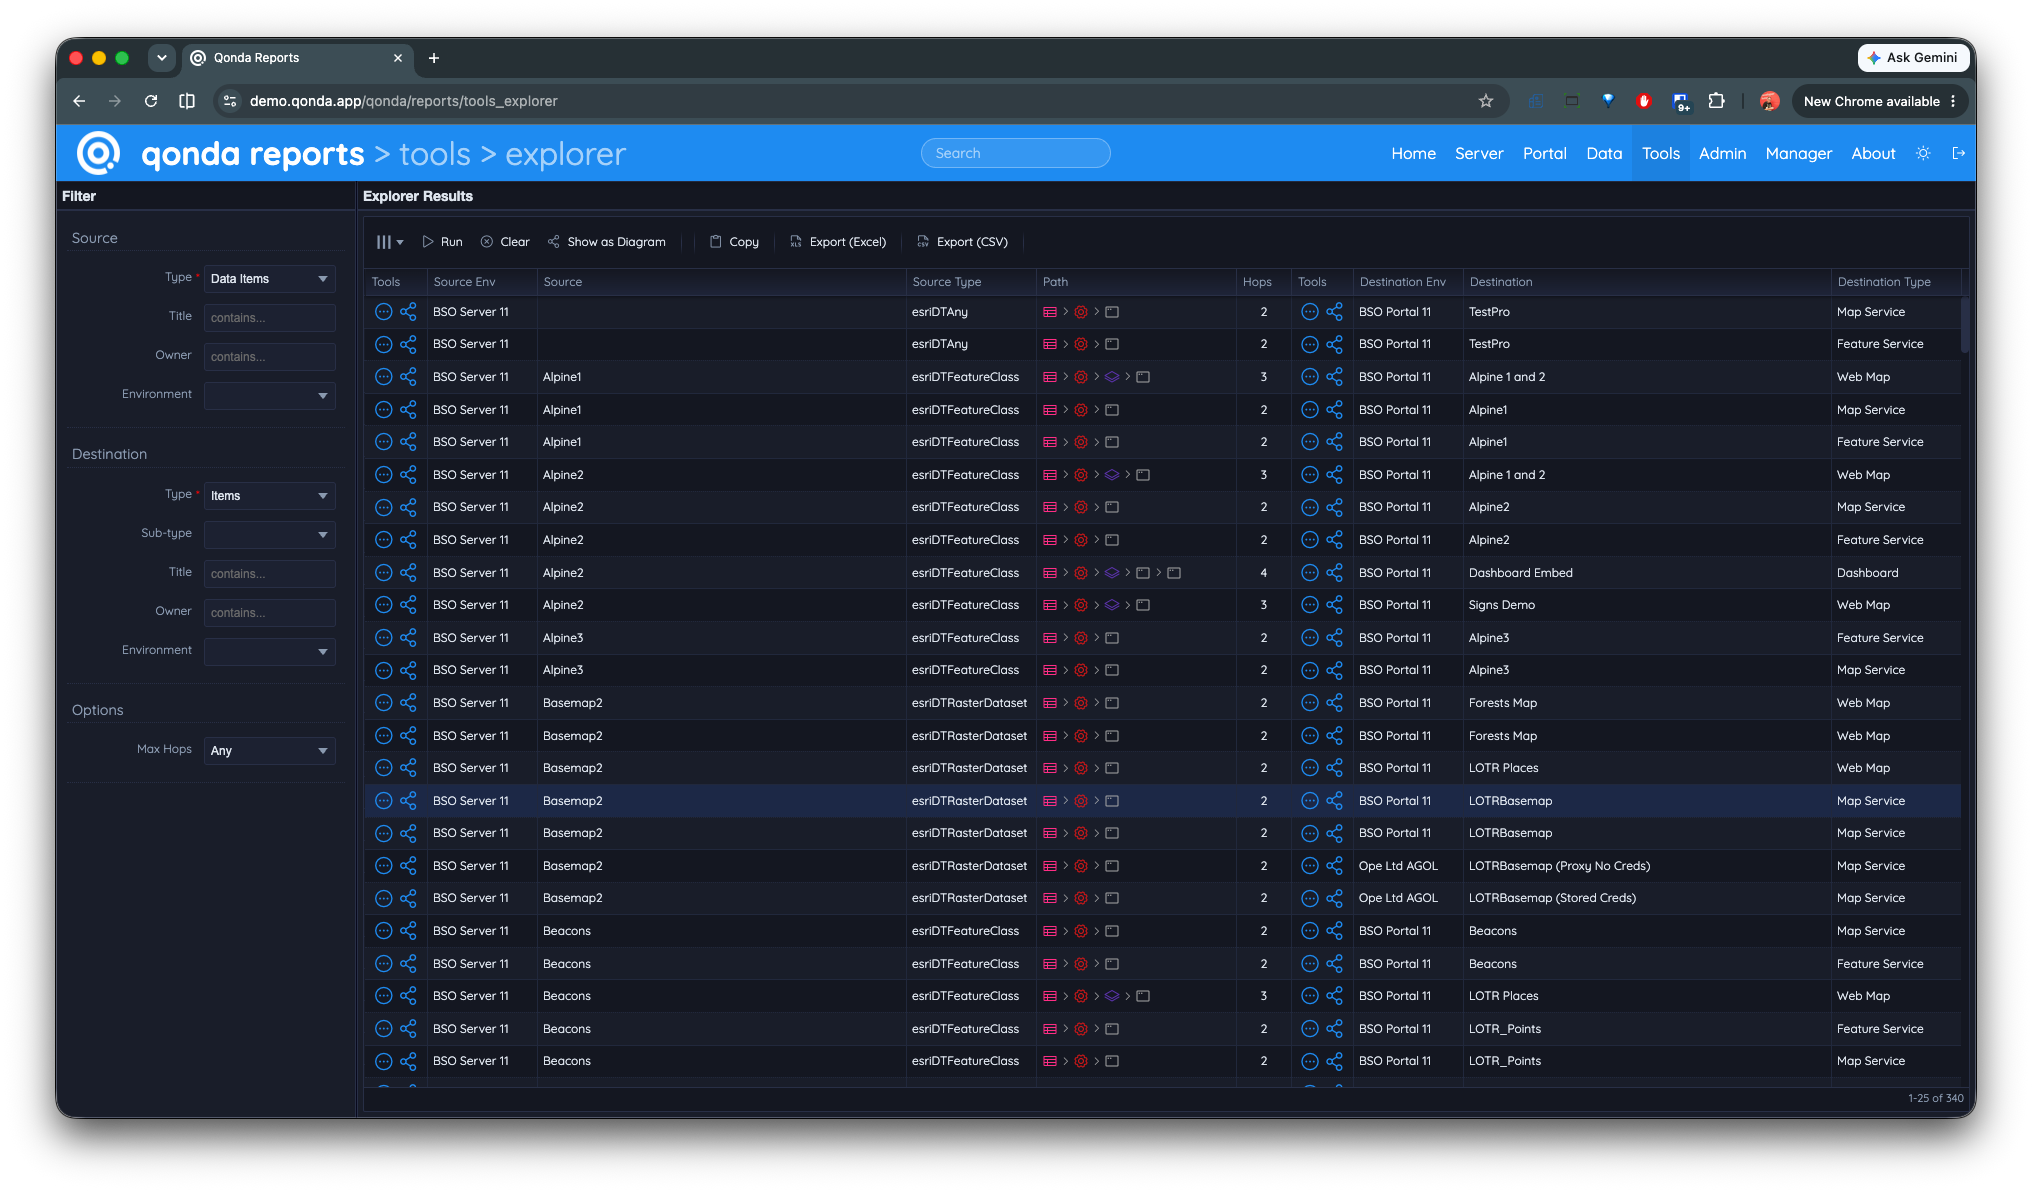
Environment Explorer
Browse items, users, groups, roles, services, and layers across all your connected environments in a single
hierarchical tree.
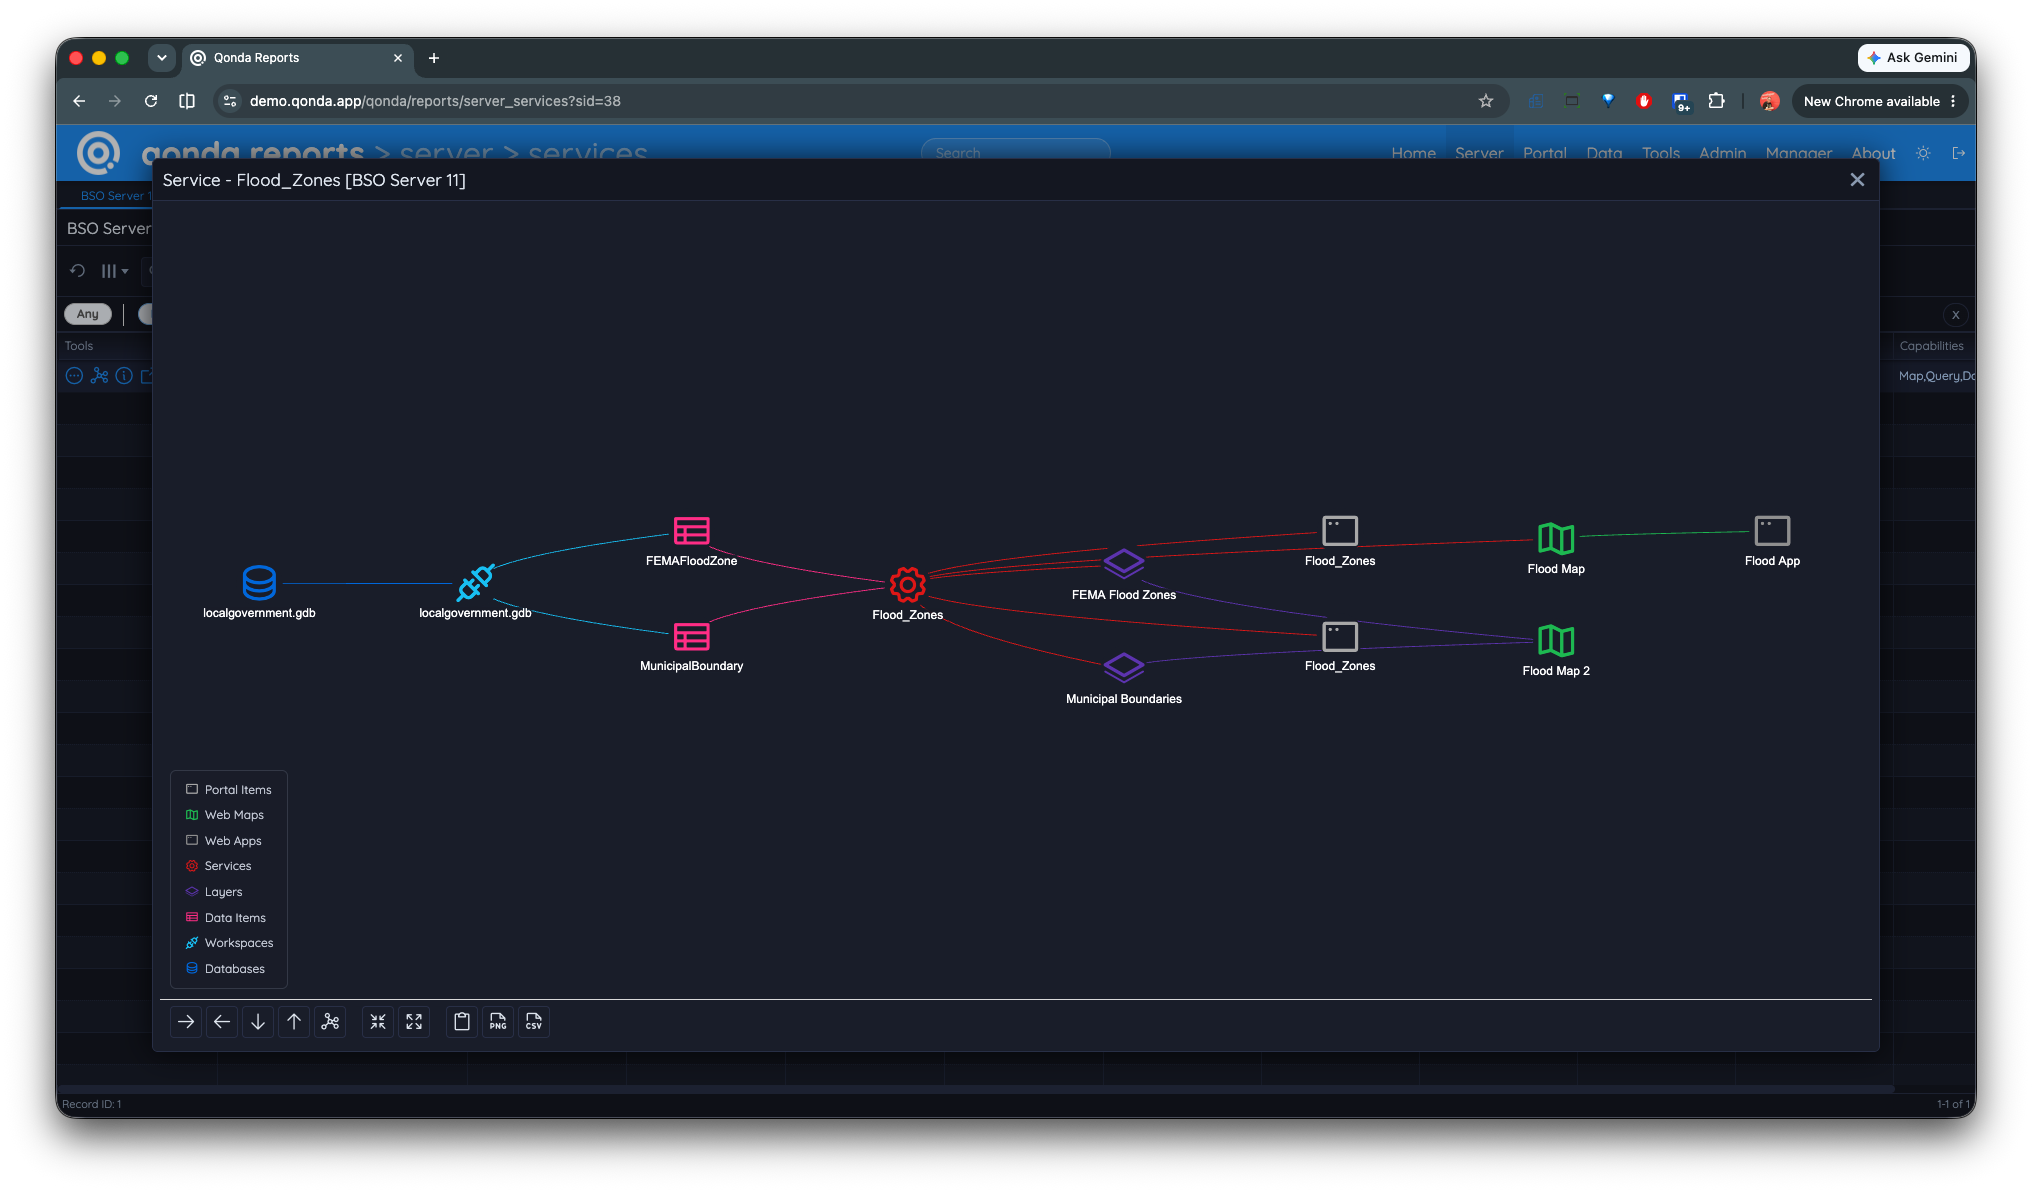
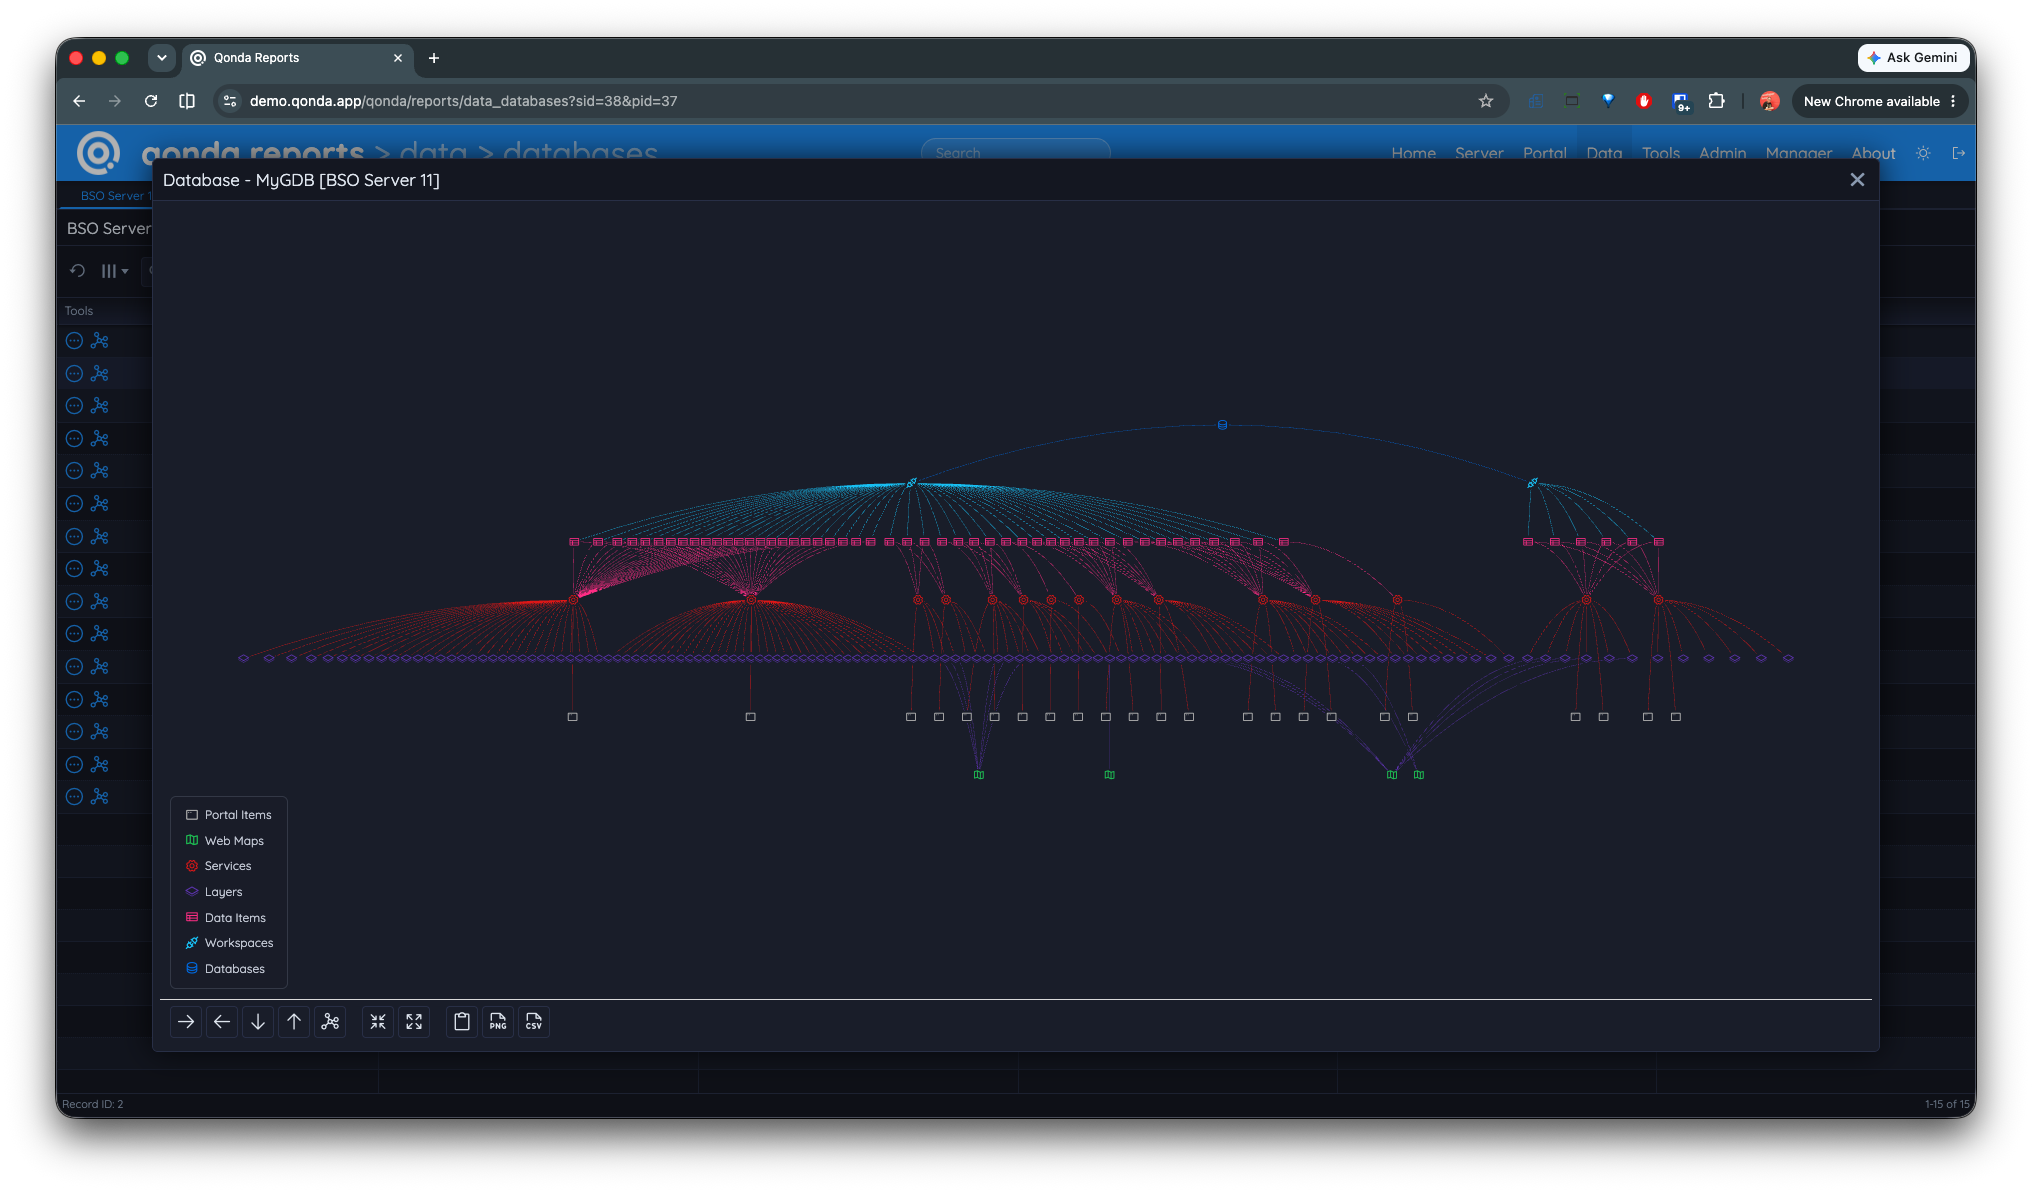
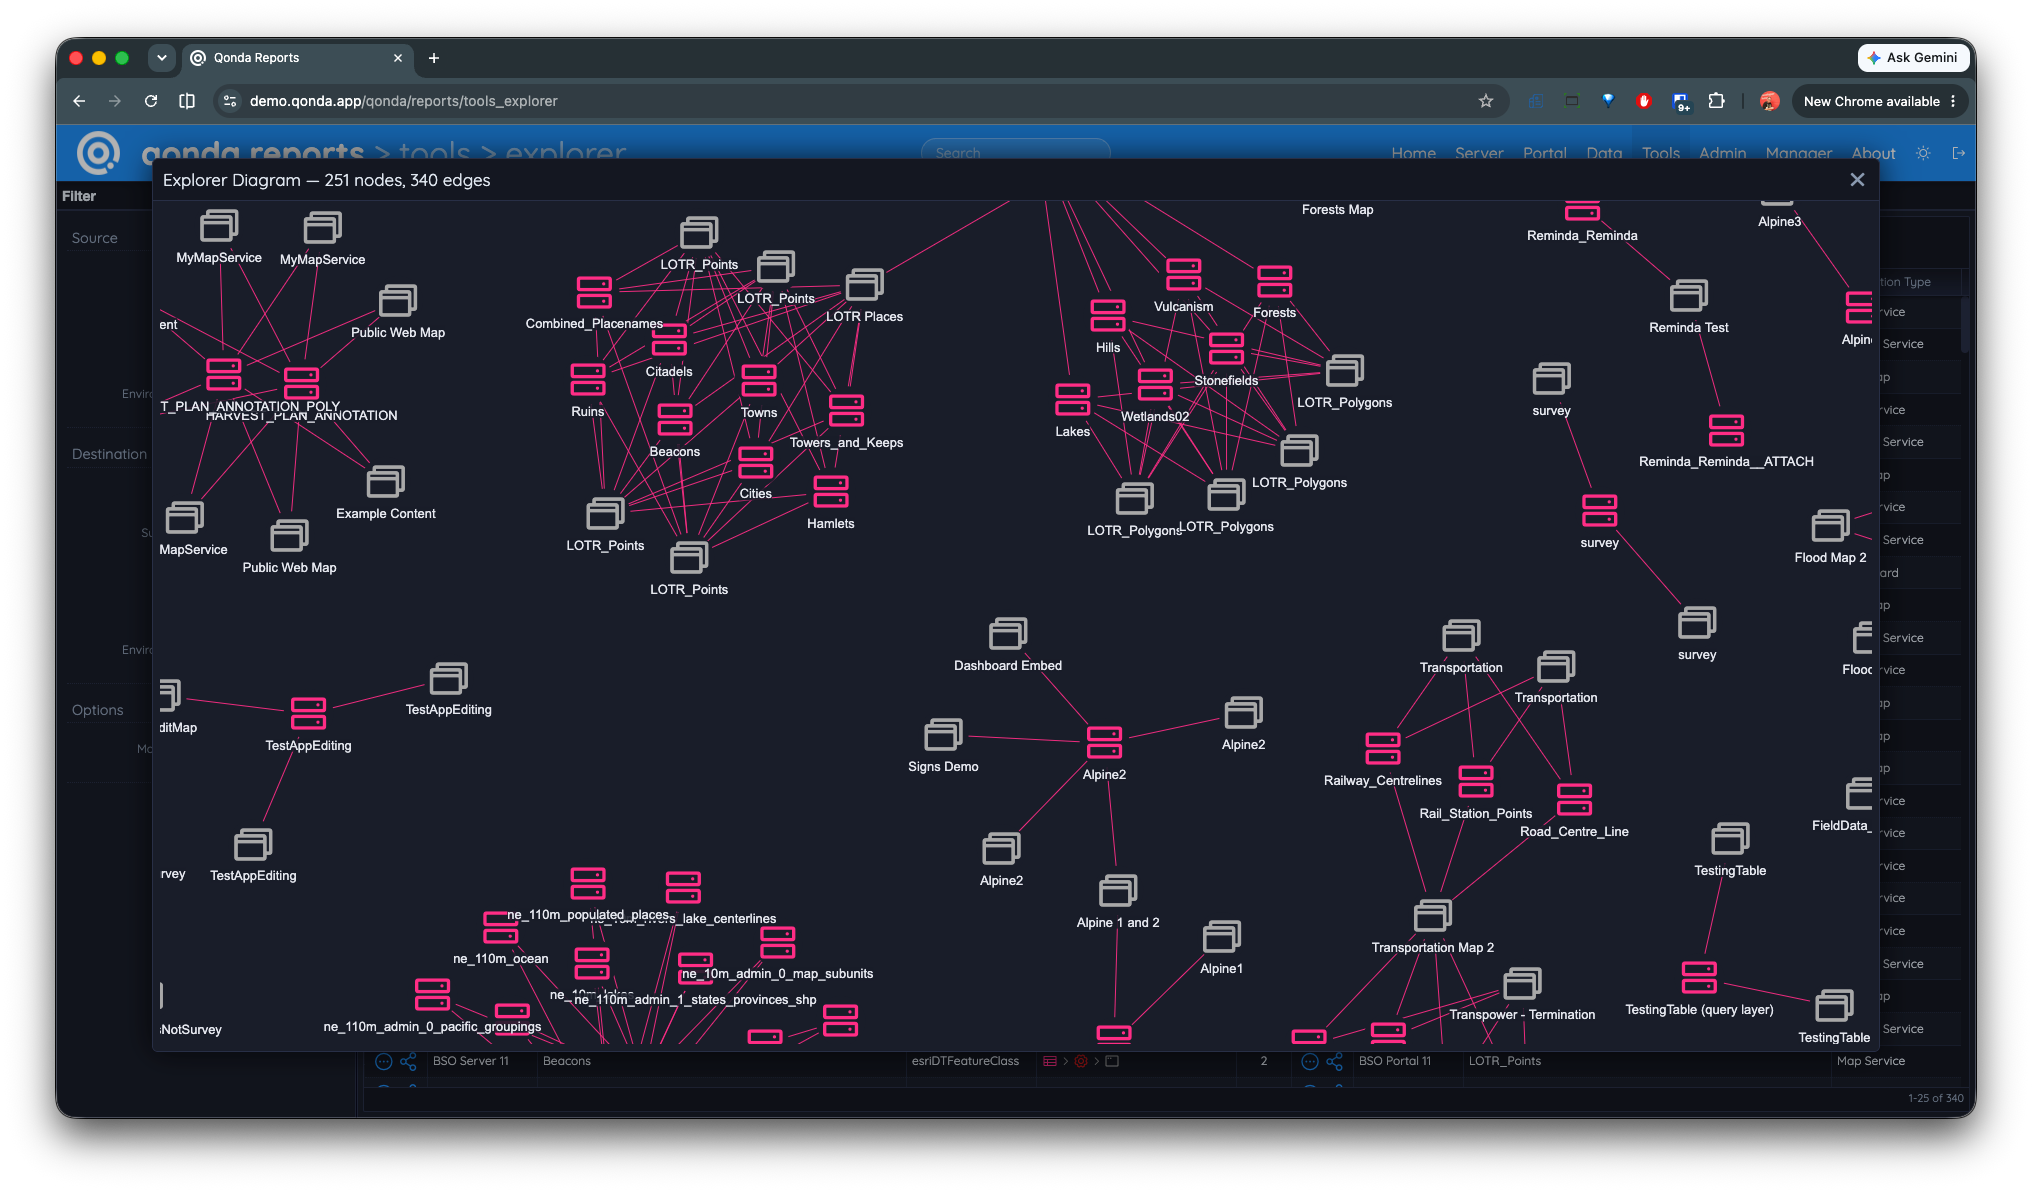
Relationship Diagrams
Visualise how maps, apps, layers, and services connect to each other. Discover transitive dependencies
across any number of hops.
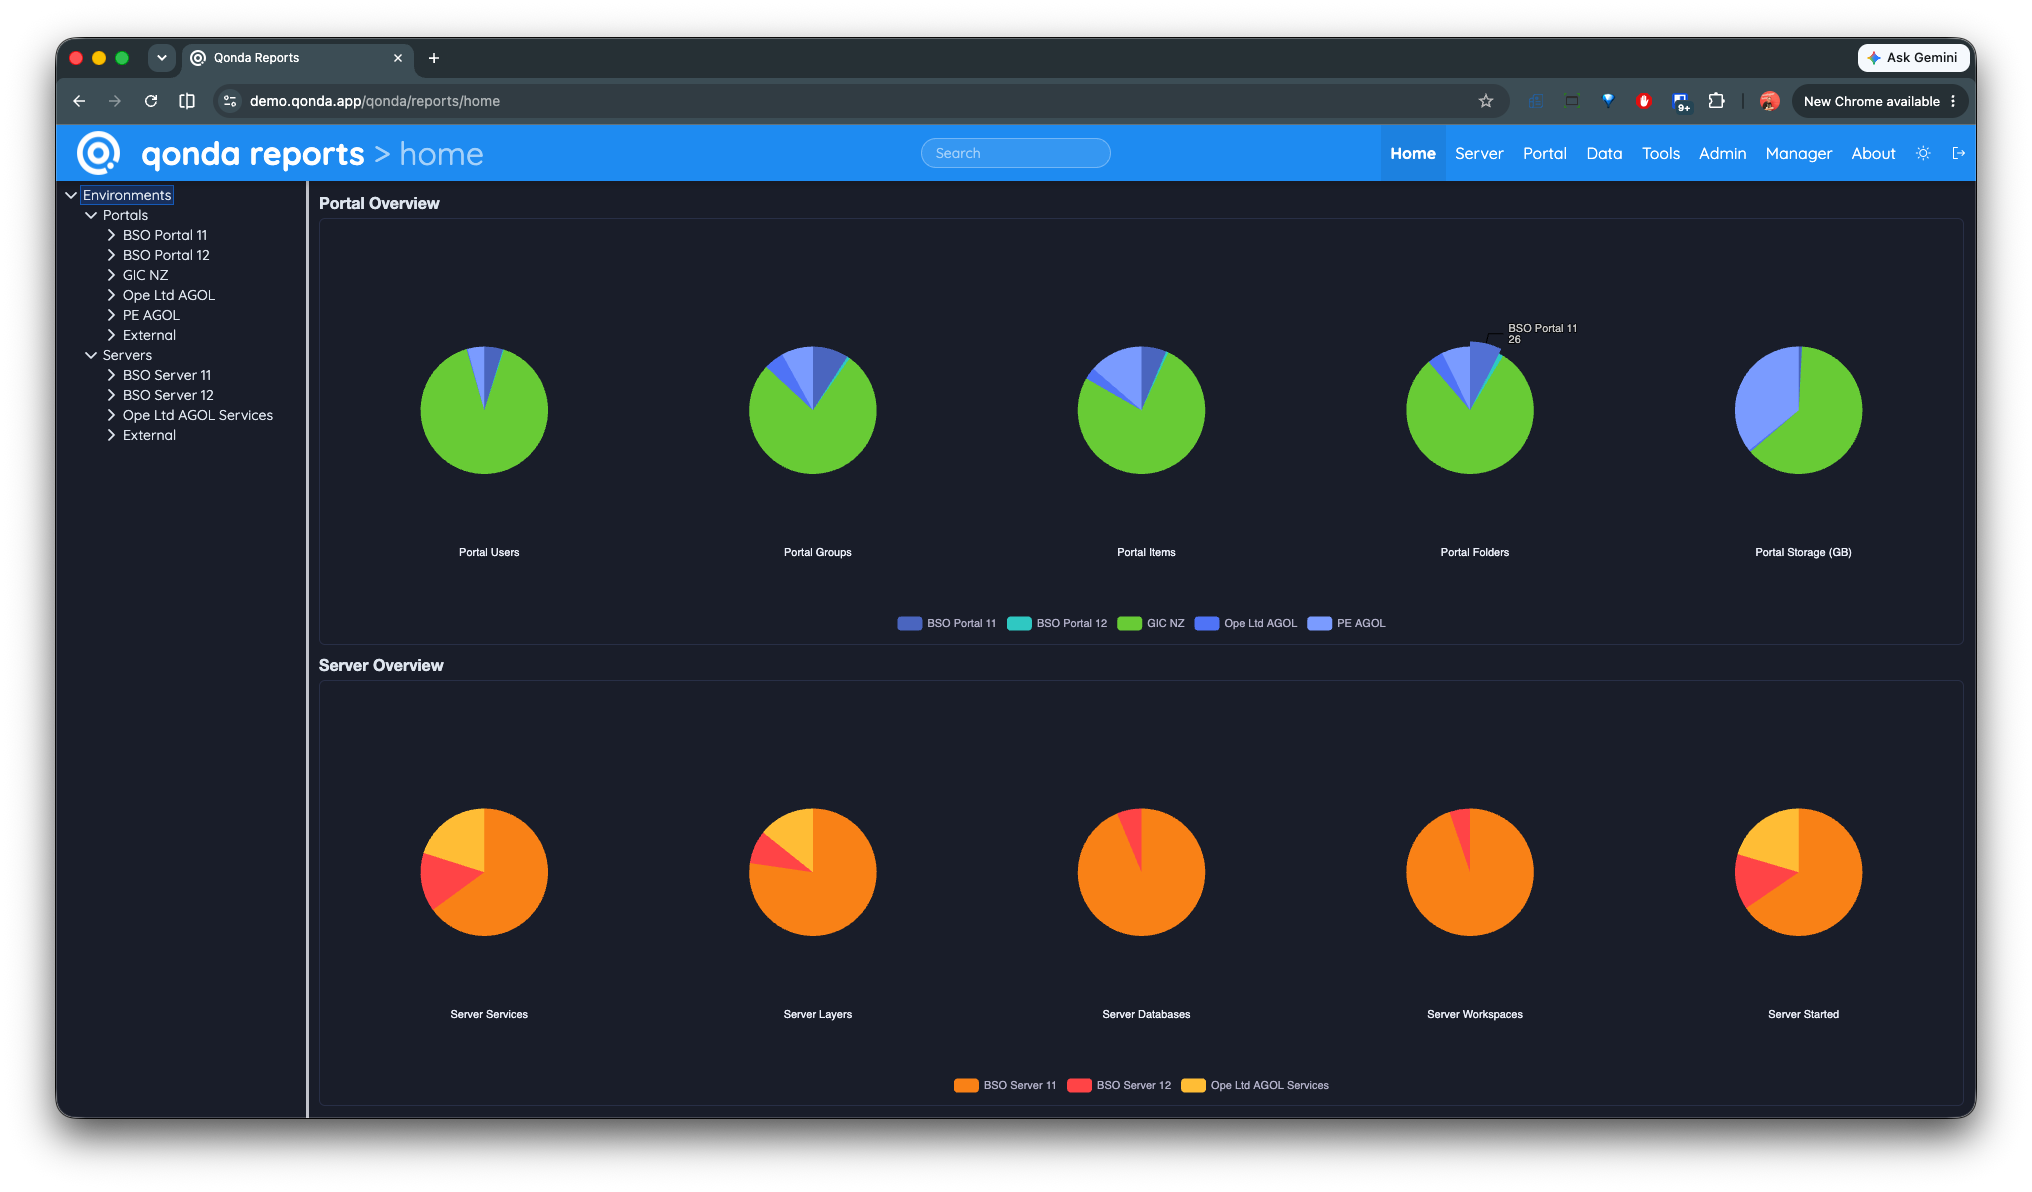
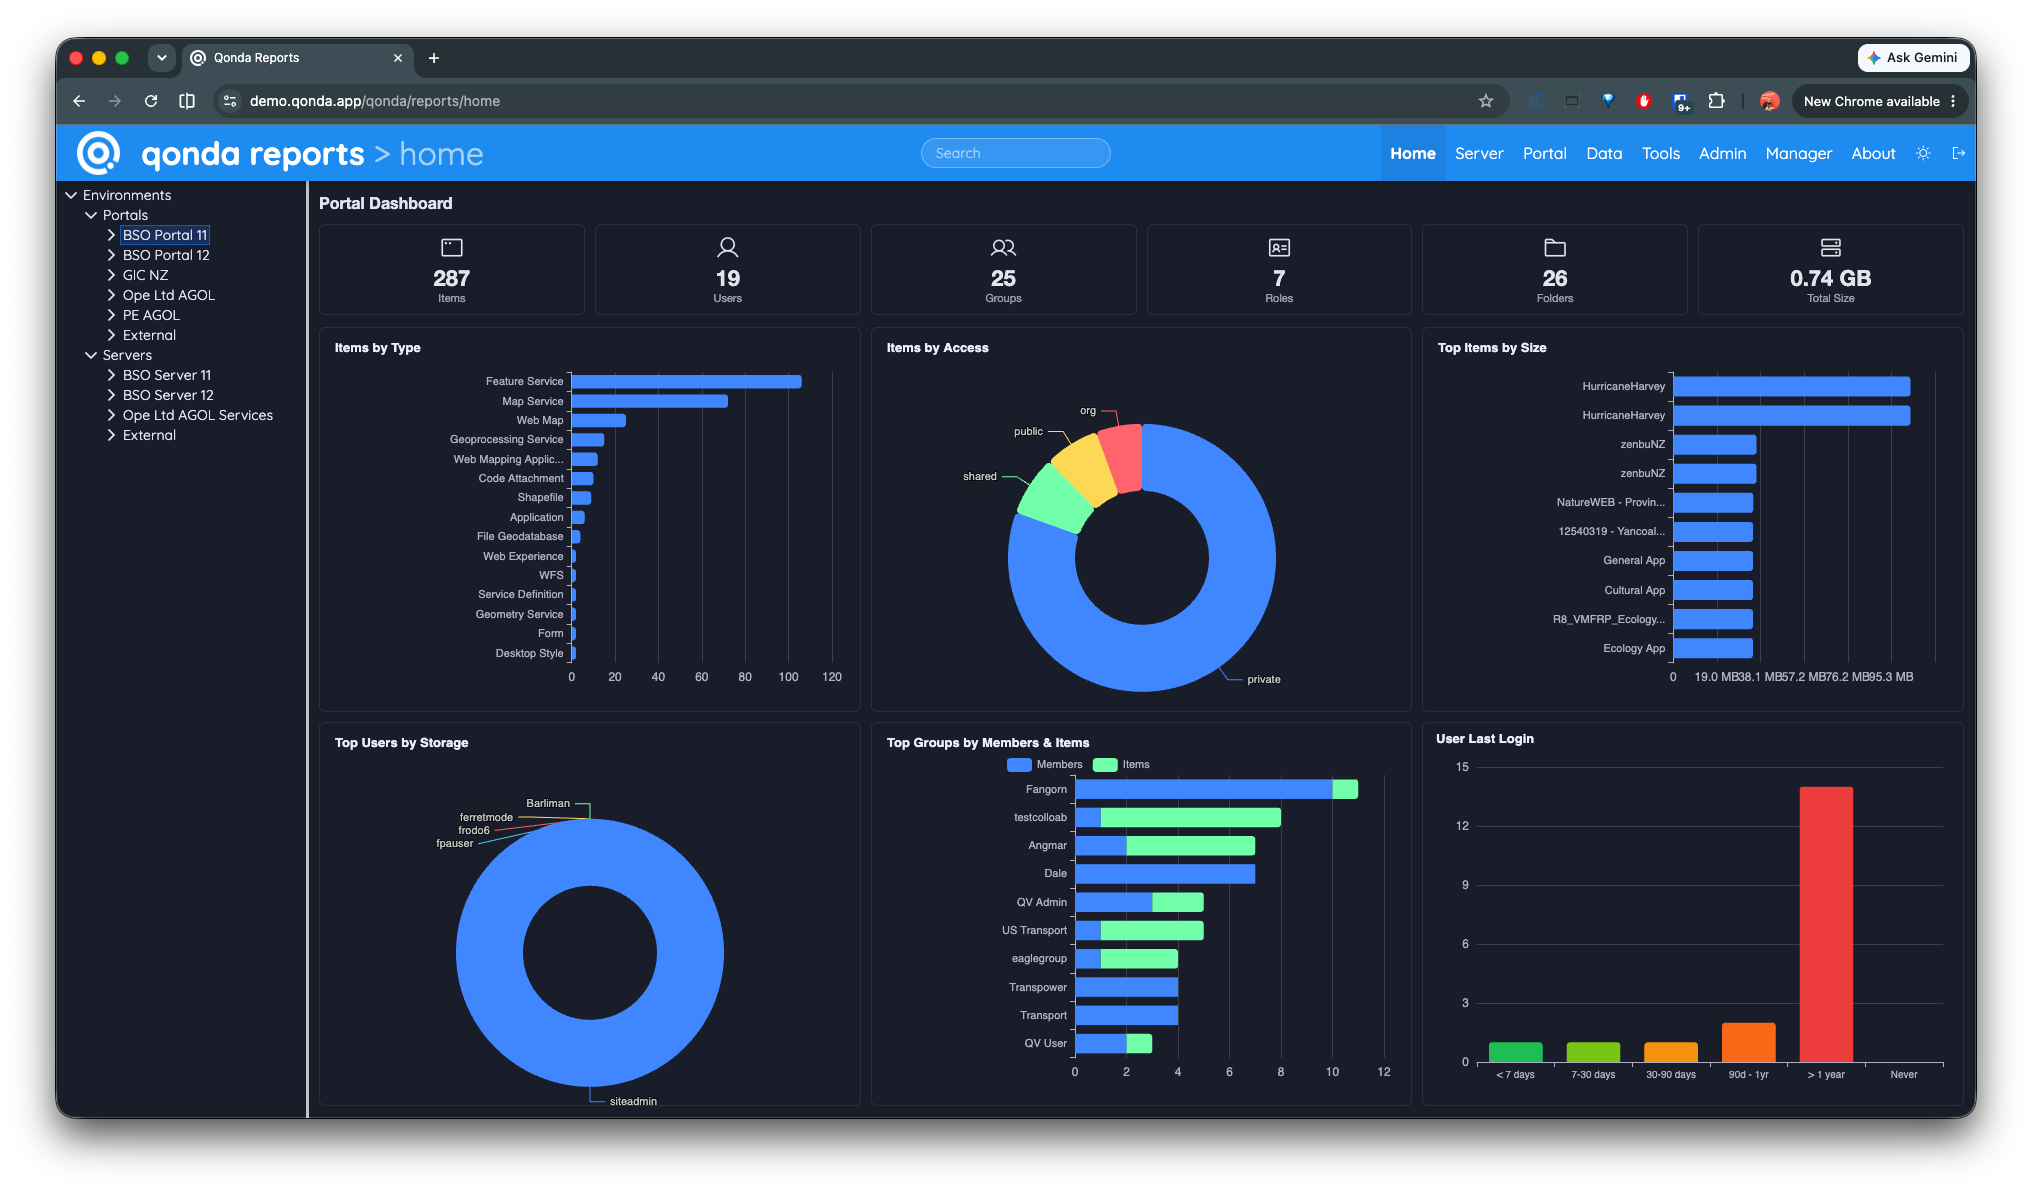
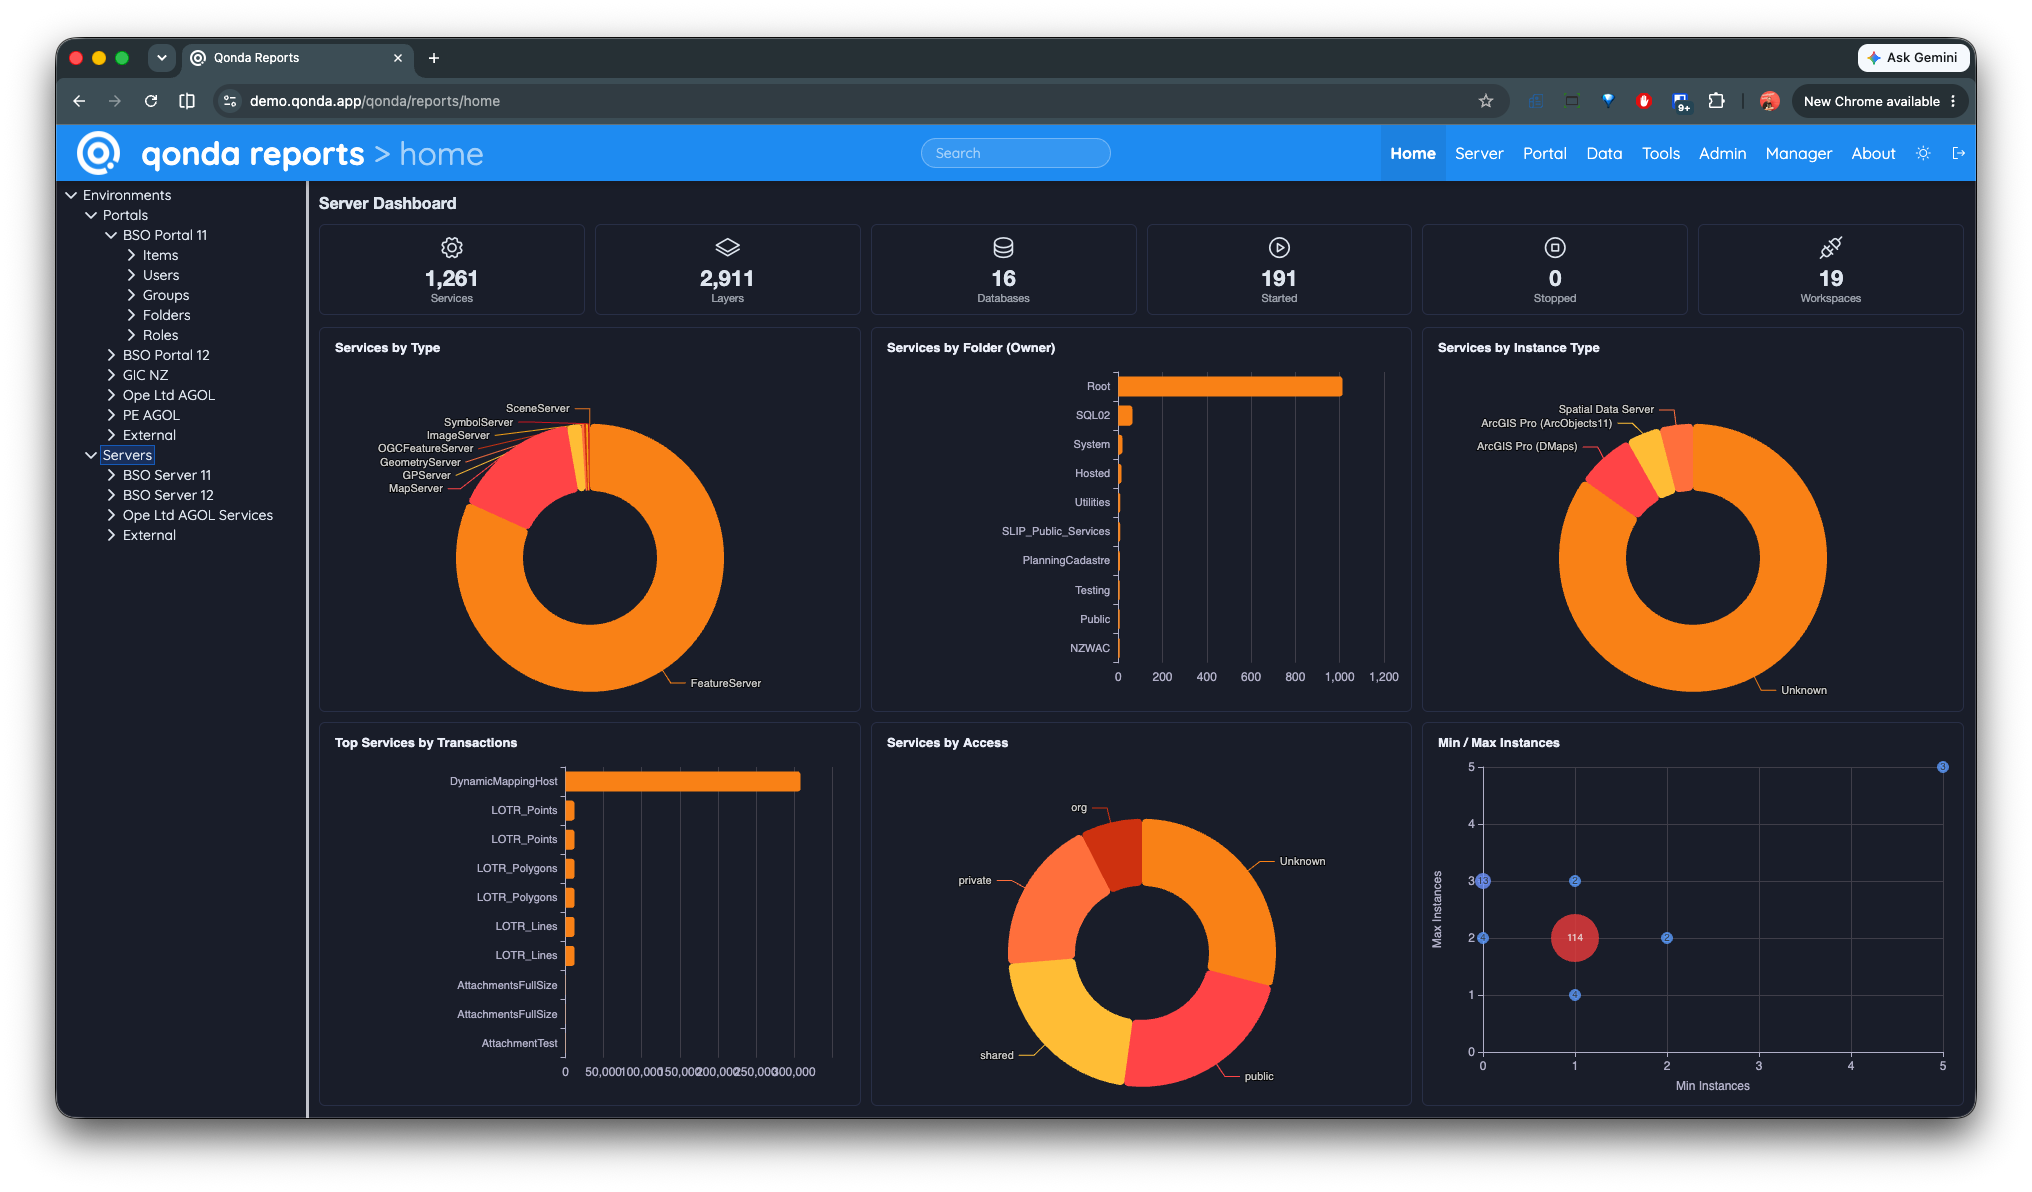
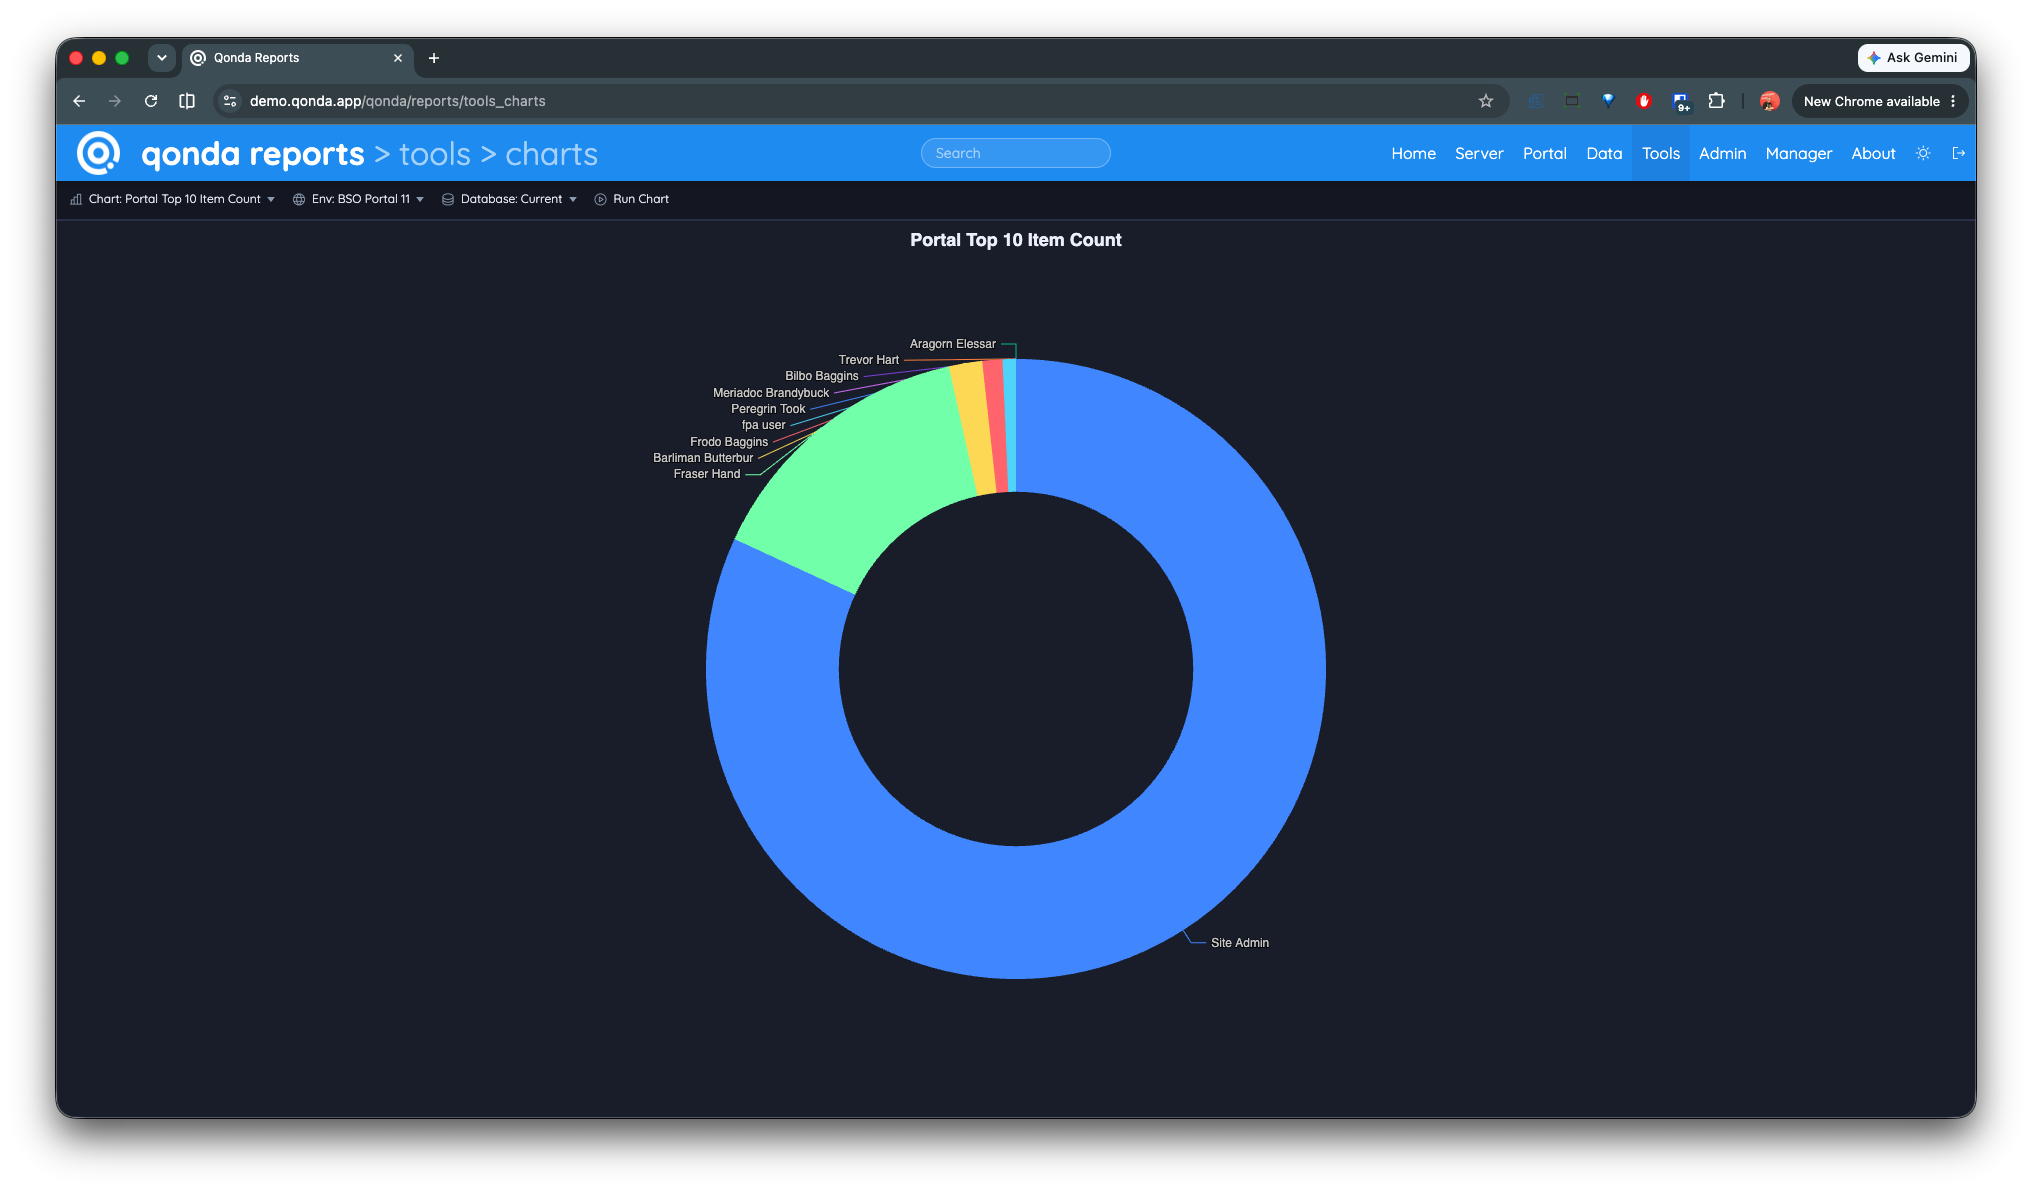
Charts & Dashboards
Pre-built and custom charts summarise item counts, sizes, user activity, service health, and more - all in
real time.
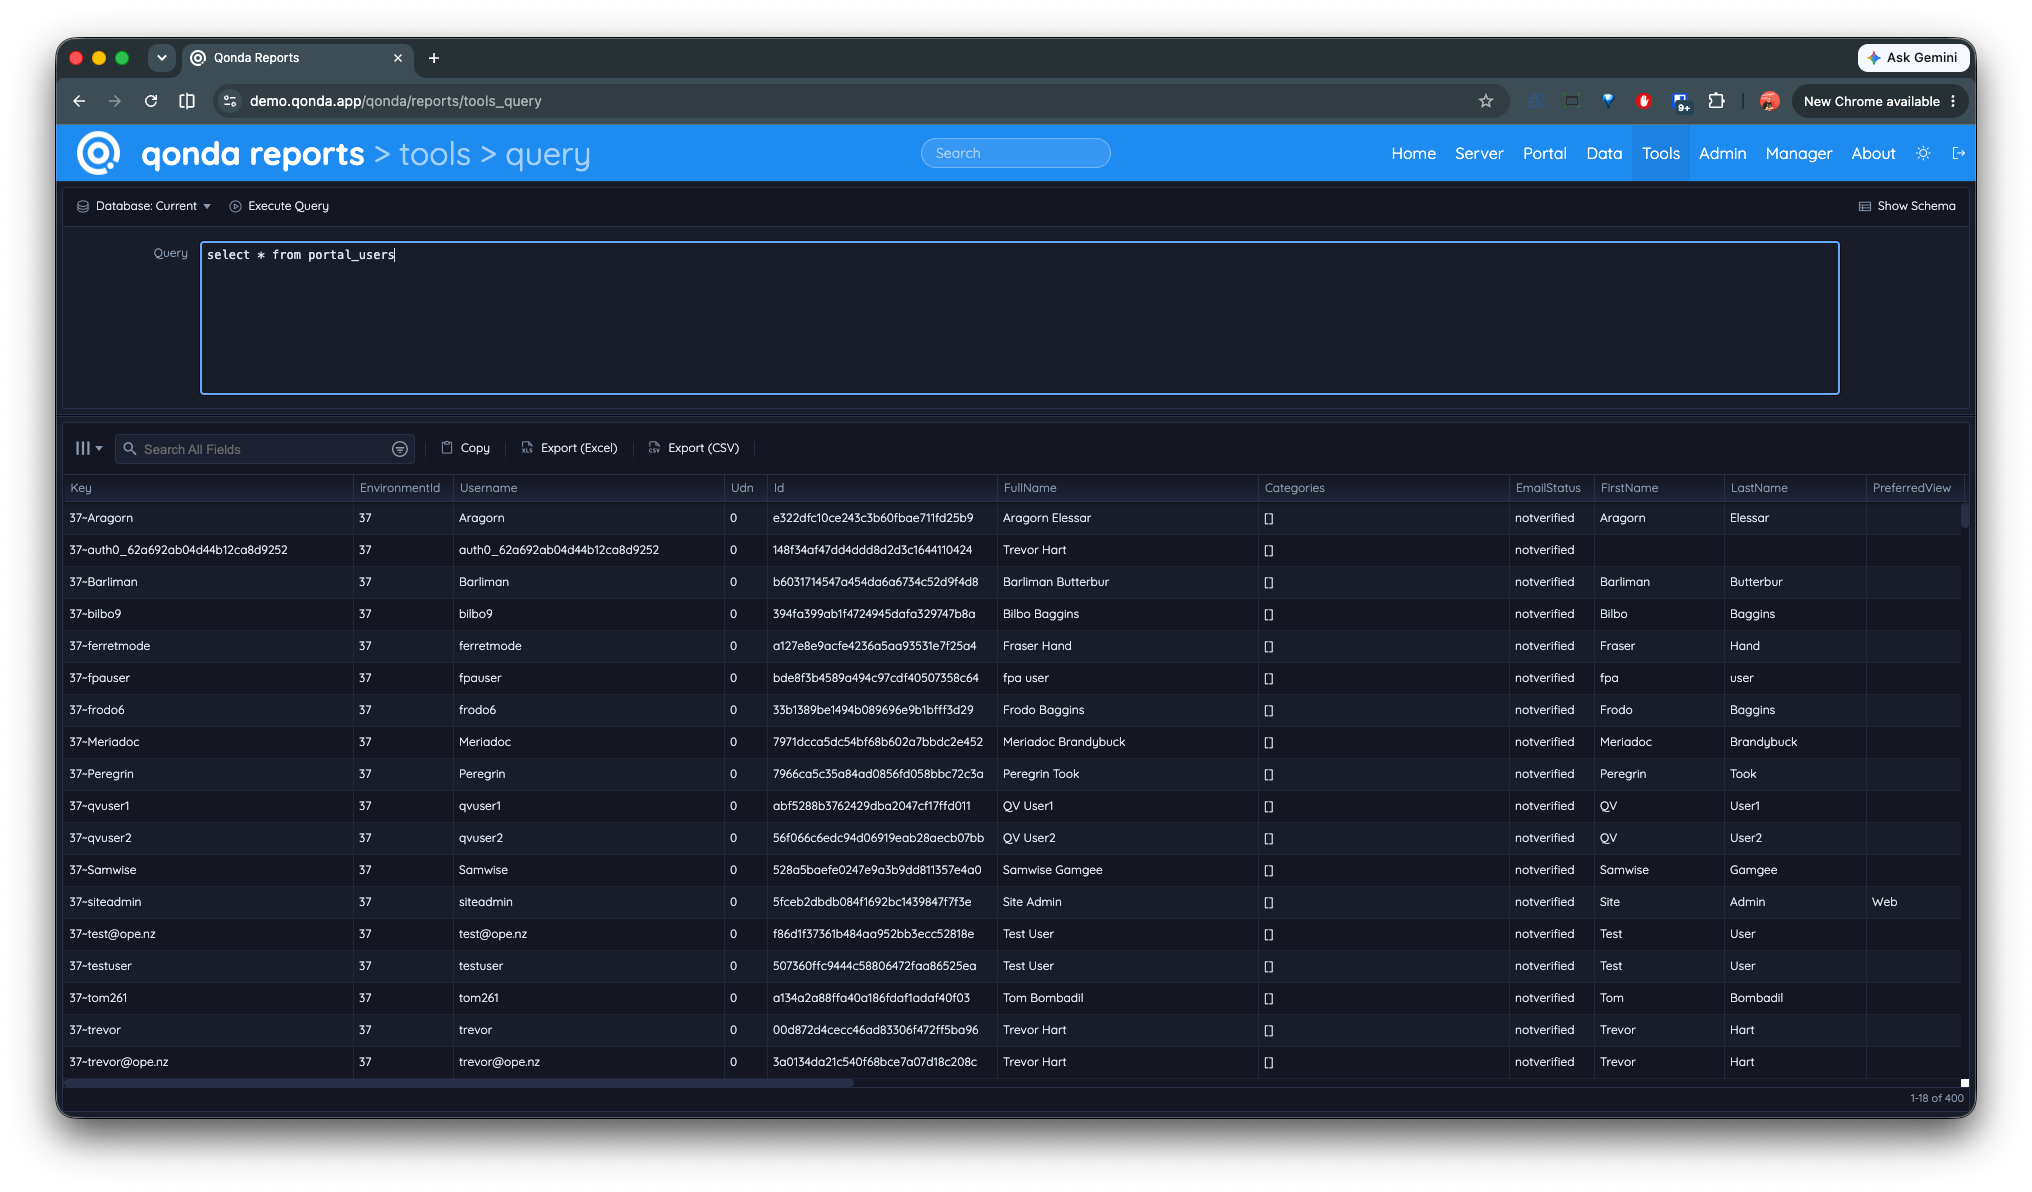
Custom Report Builder
Write SQL queries against your collected data, save them as named reports, and share results with
colleagues as Excel or CSV exports.
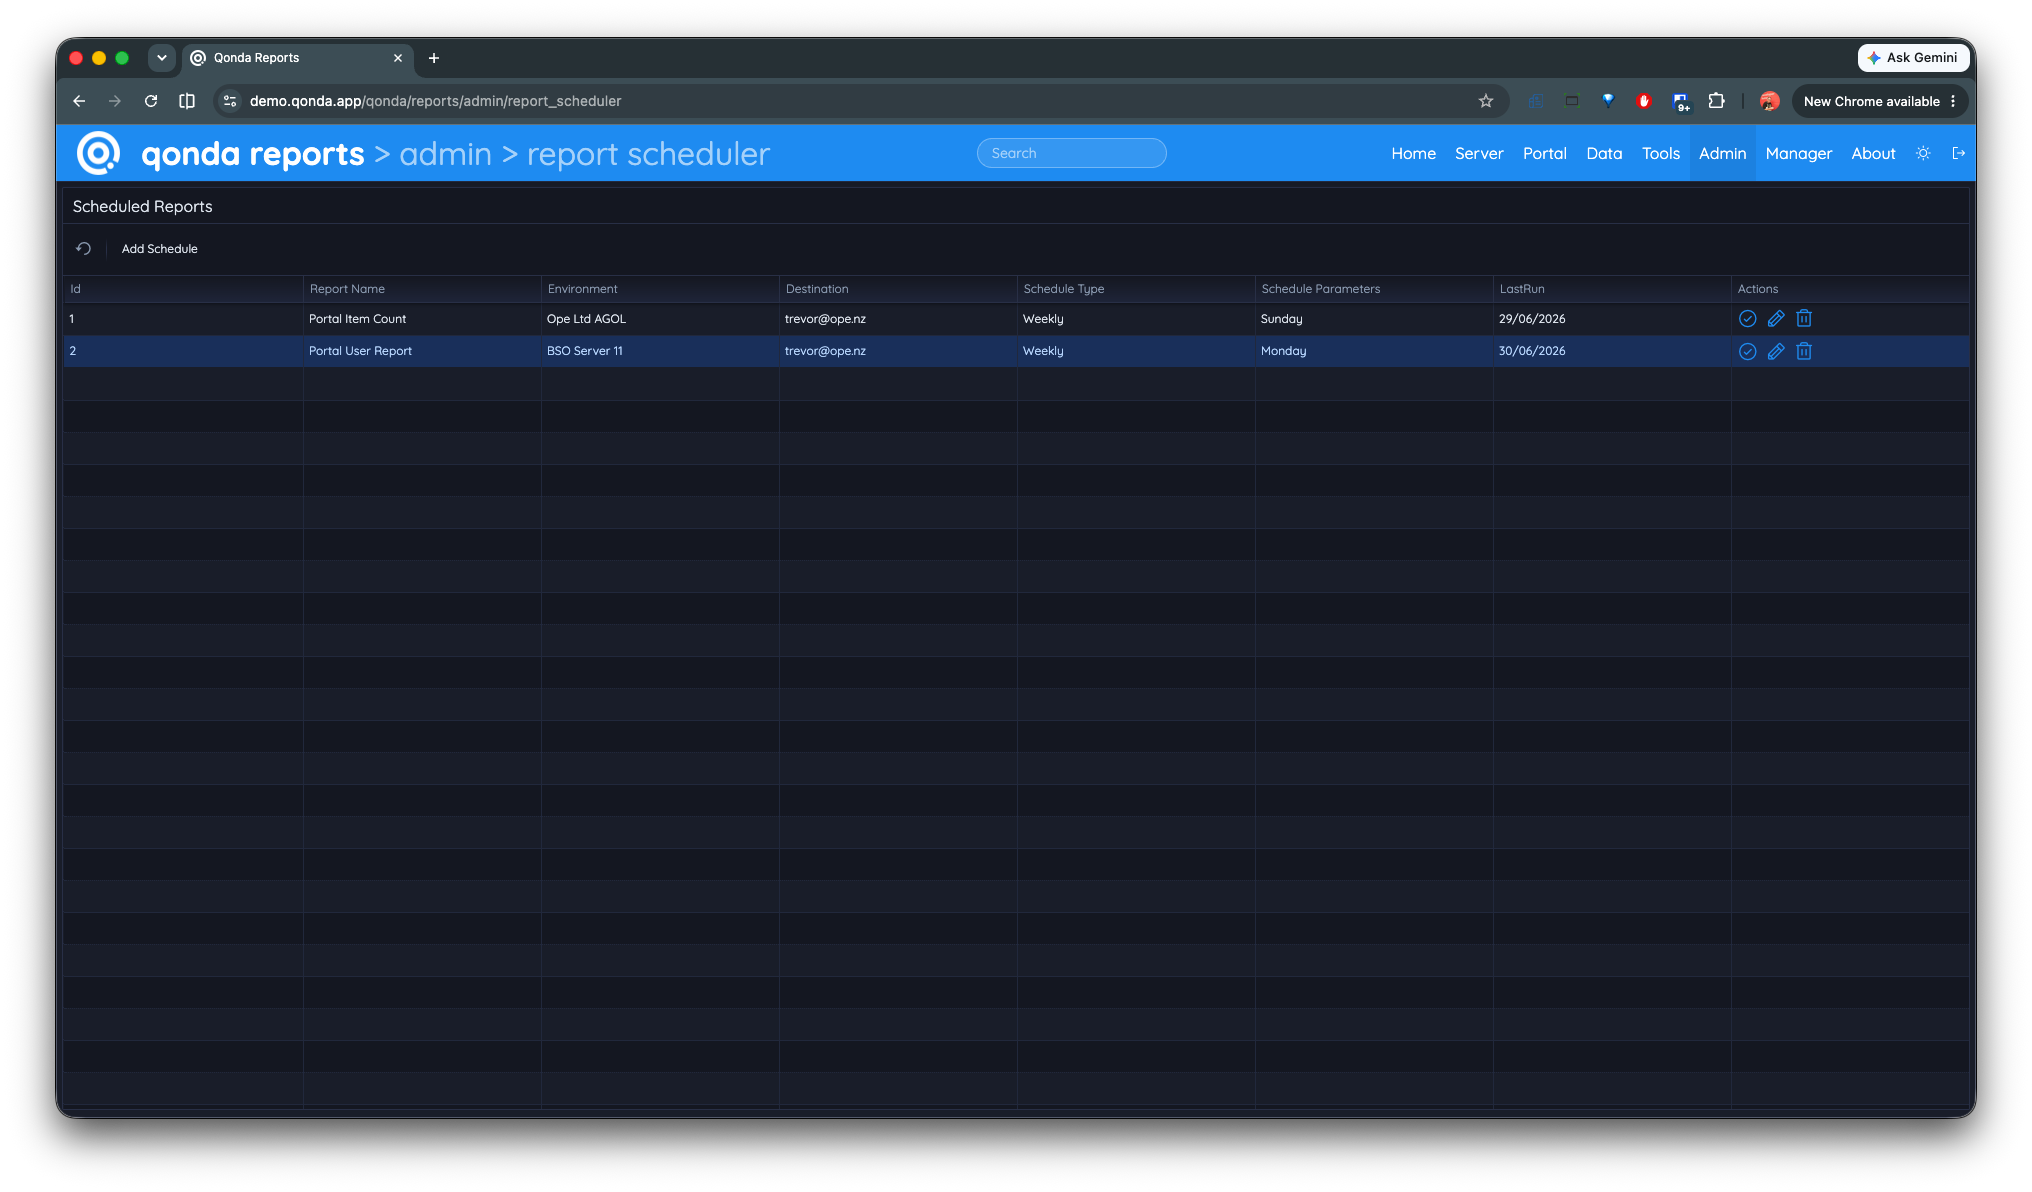
Scheduled Delivery
Configure any report to run automatically on a daily, weekly, or monthly schedule and deliver results
straight to an inbox.
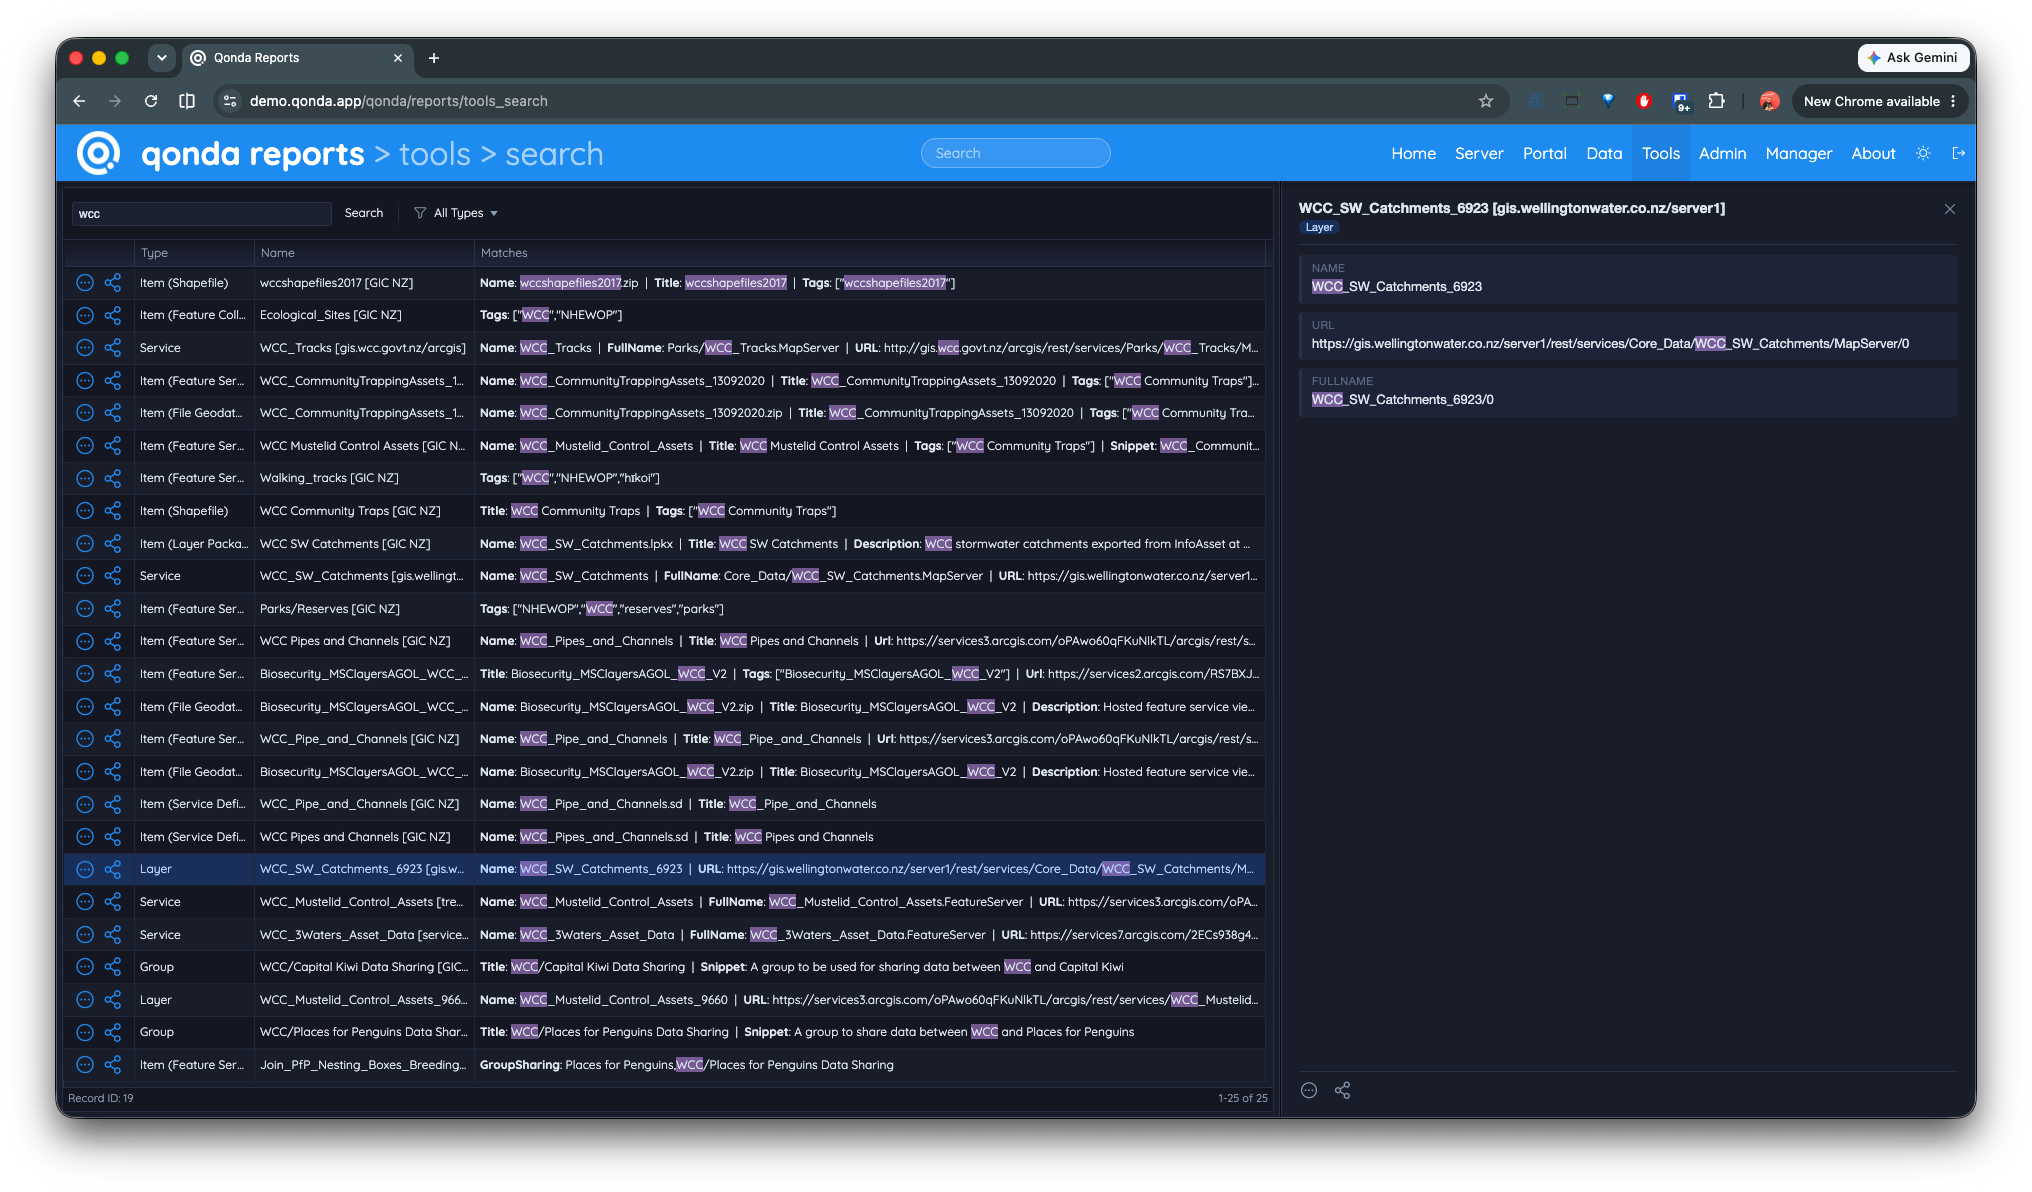
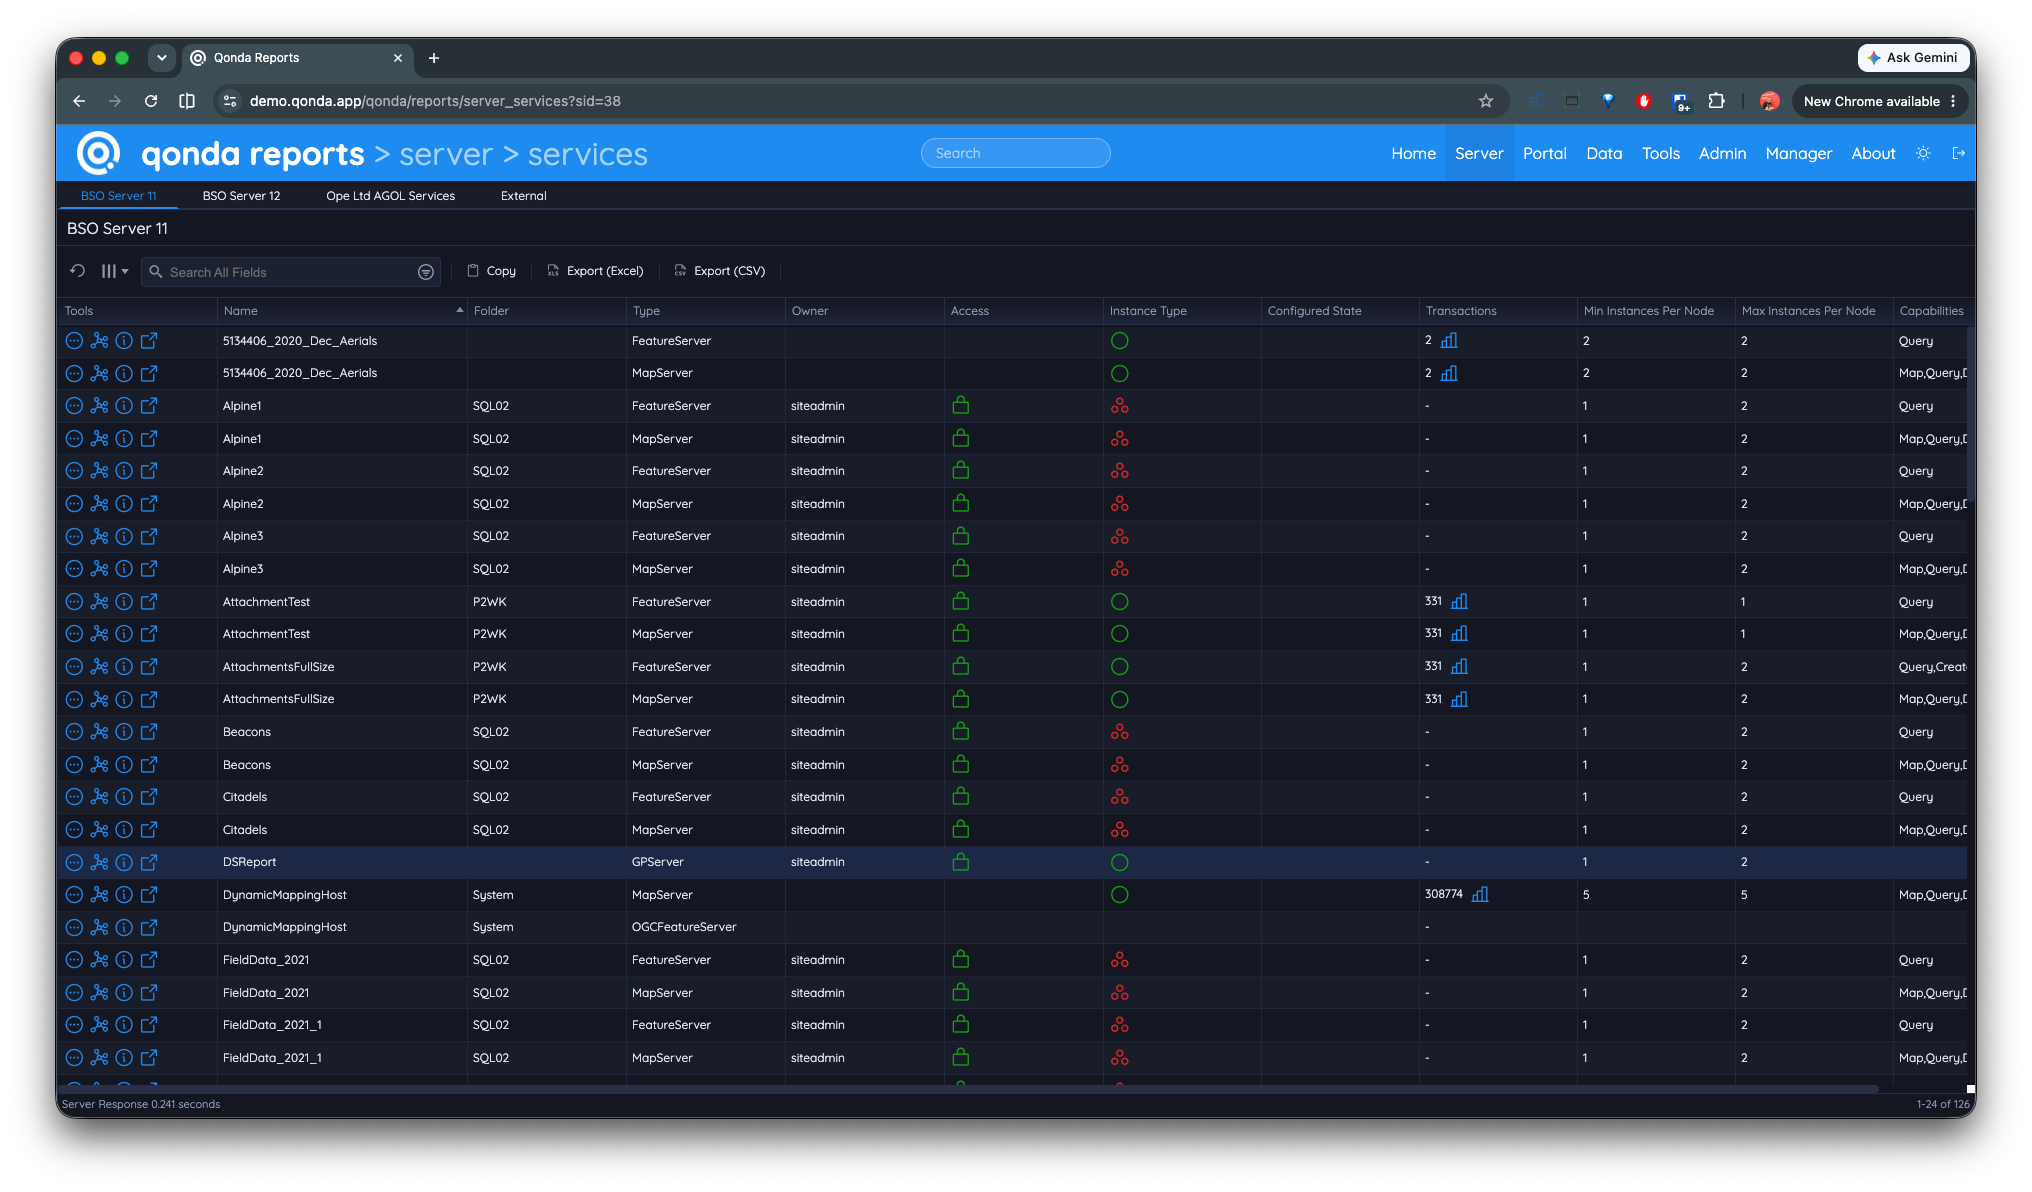
Full-Text Search
Search across every item, user, service, and layer in your environments instantly. Filter, sort, and export
from any result set.
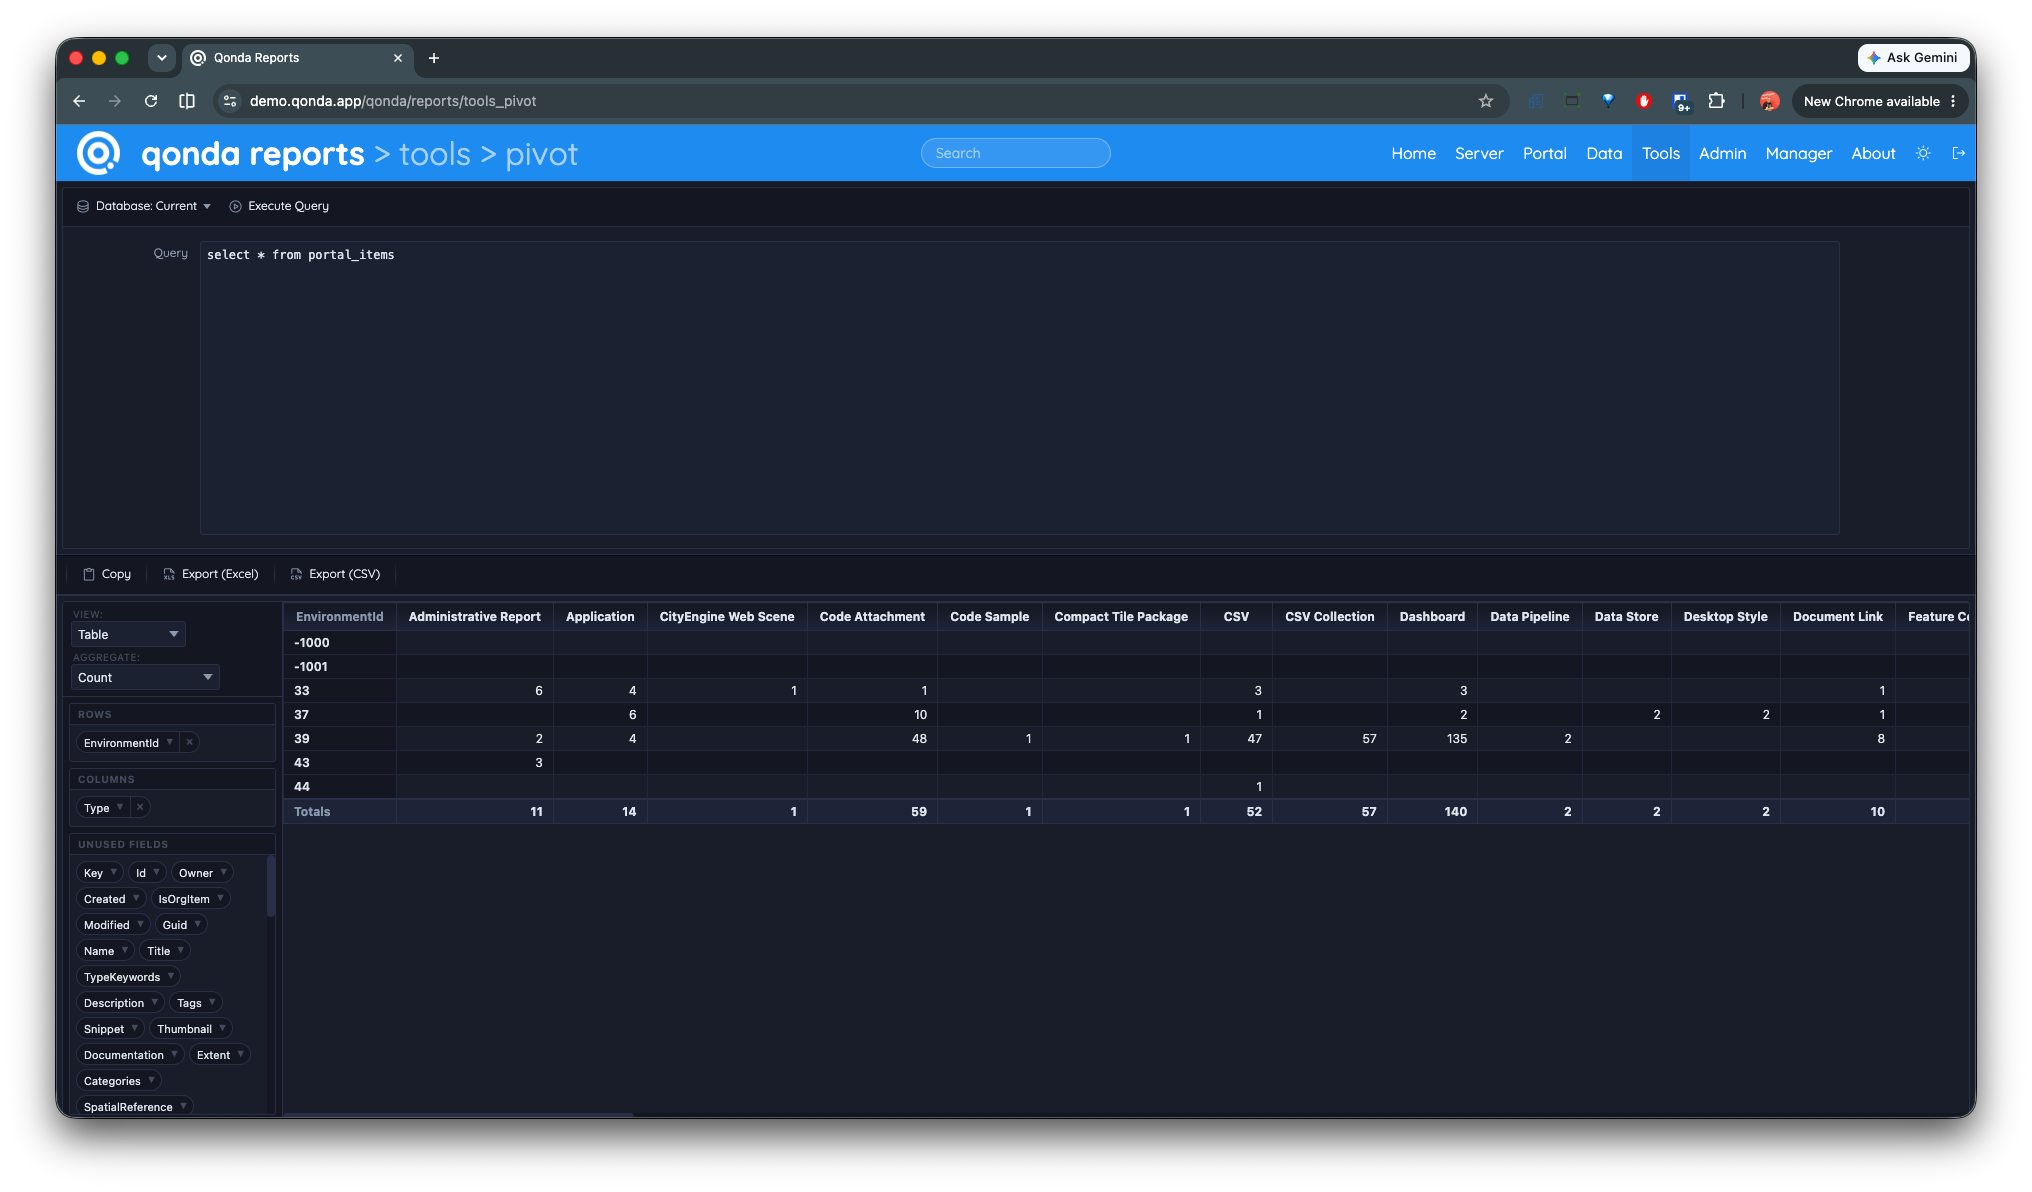
Pivot Tables
Slice and dice your ArcGIS data interactively with pivot tables - group, aggregate, and reorder without
writing a single query.
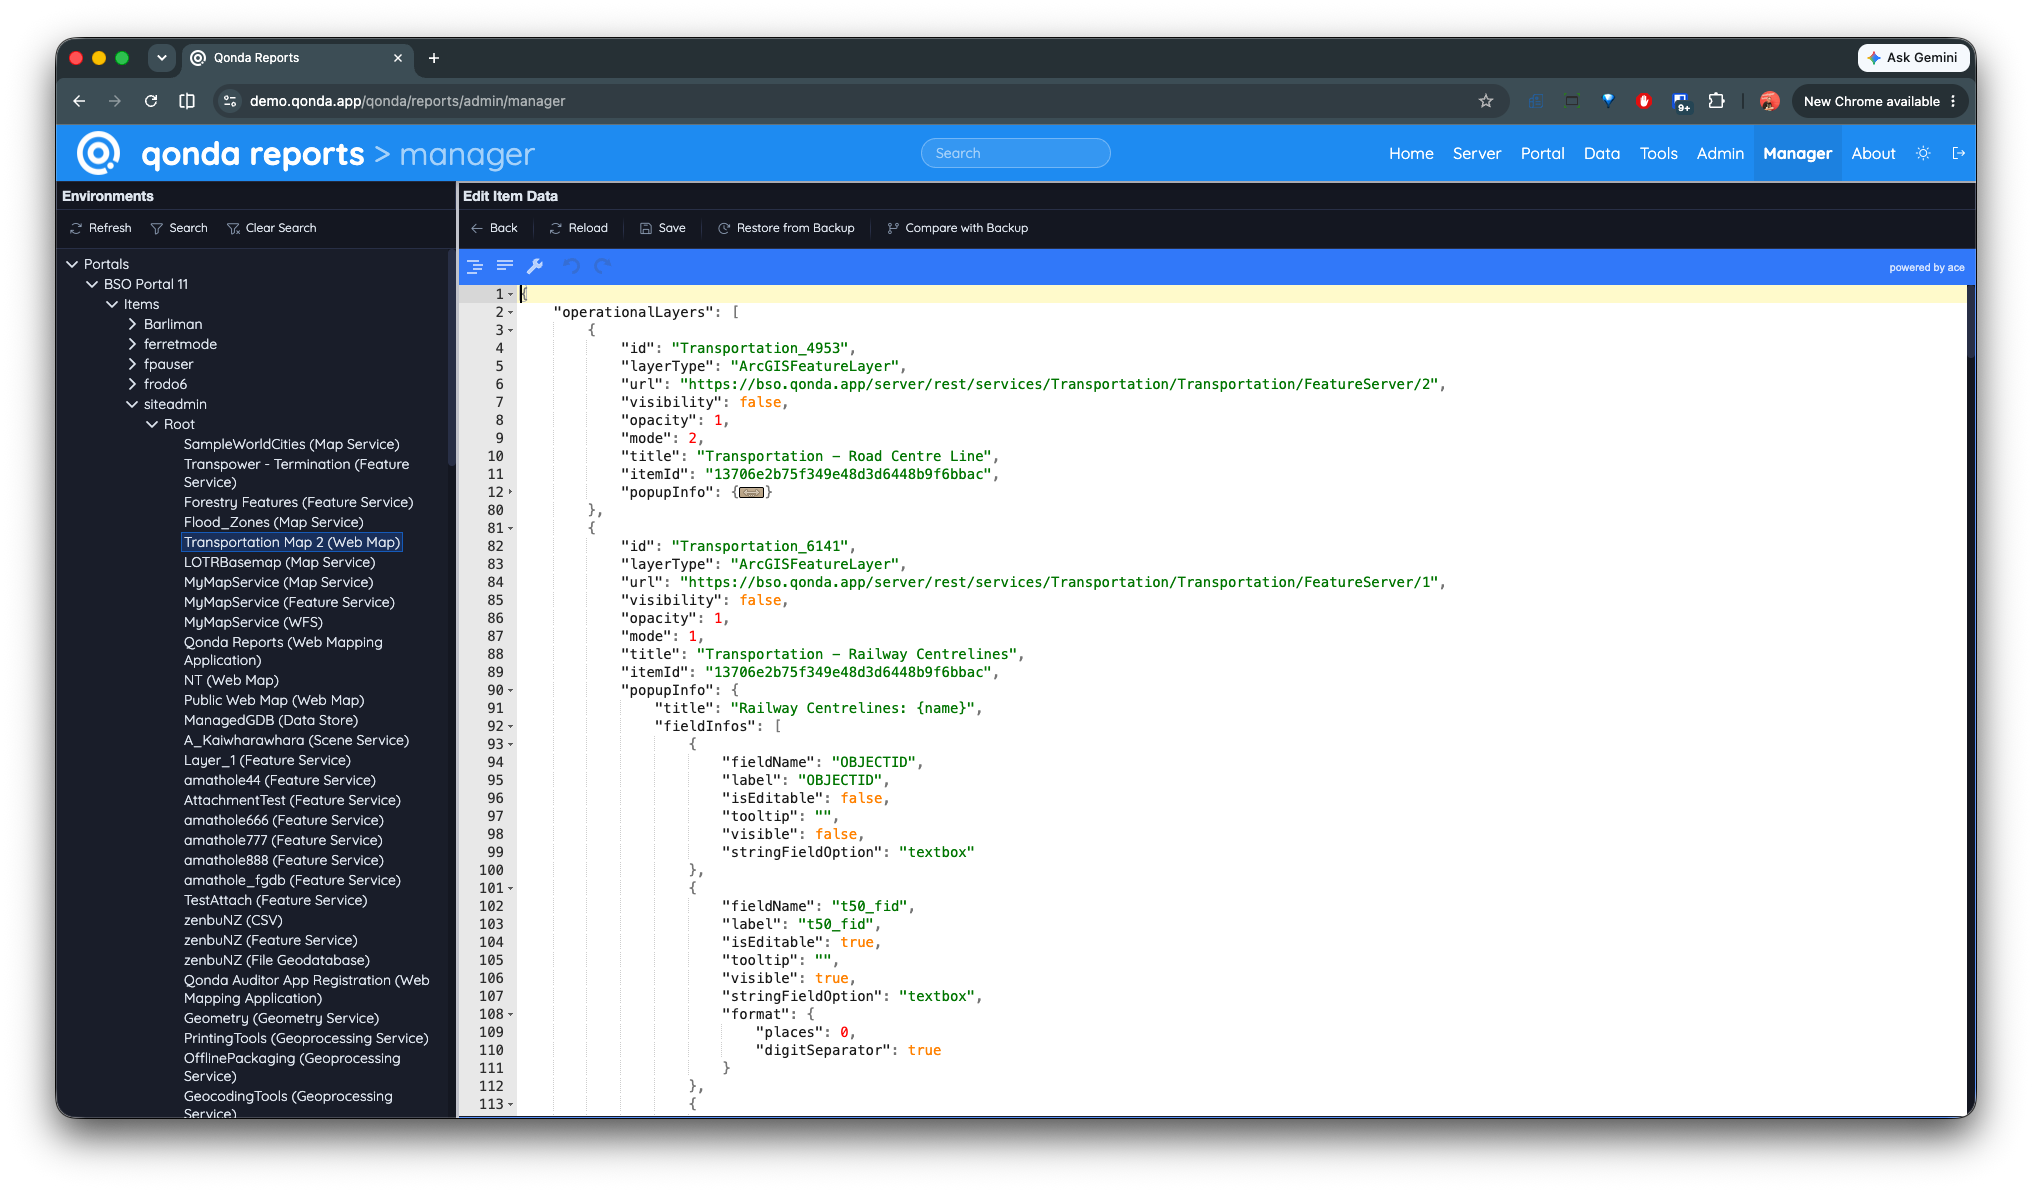
Portal Manager
View and edit Portal item metadata and JSON directly, with built-in backup, restore and bulk find/replace.
Time Travel
Historic snapshots let you view statistics, reports and content from any time in the past.
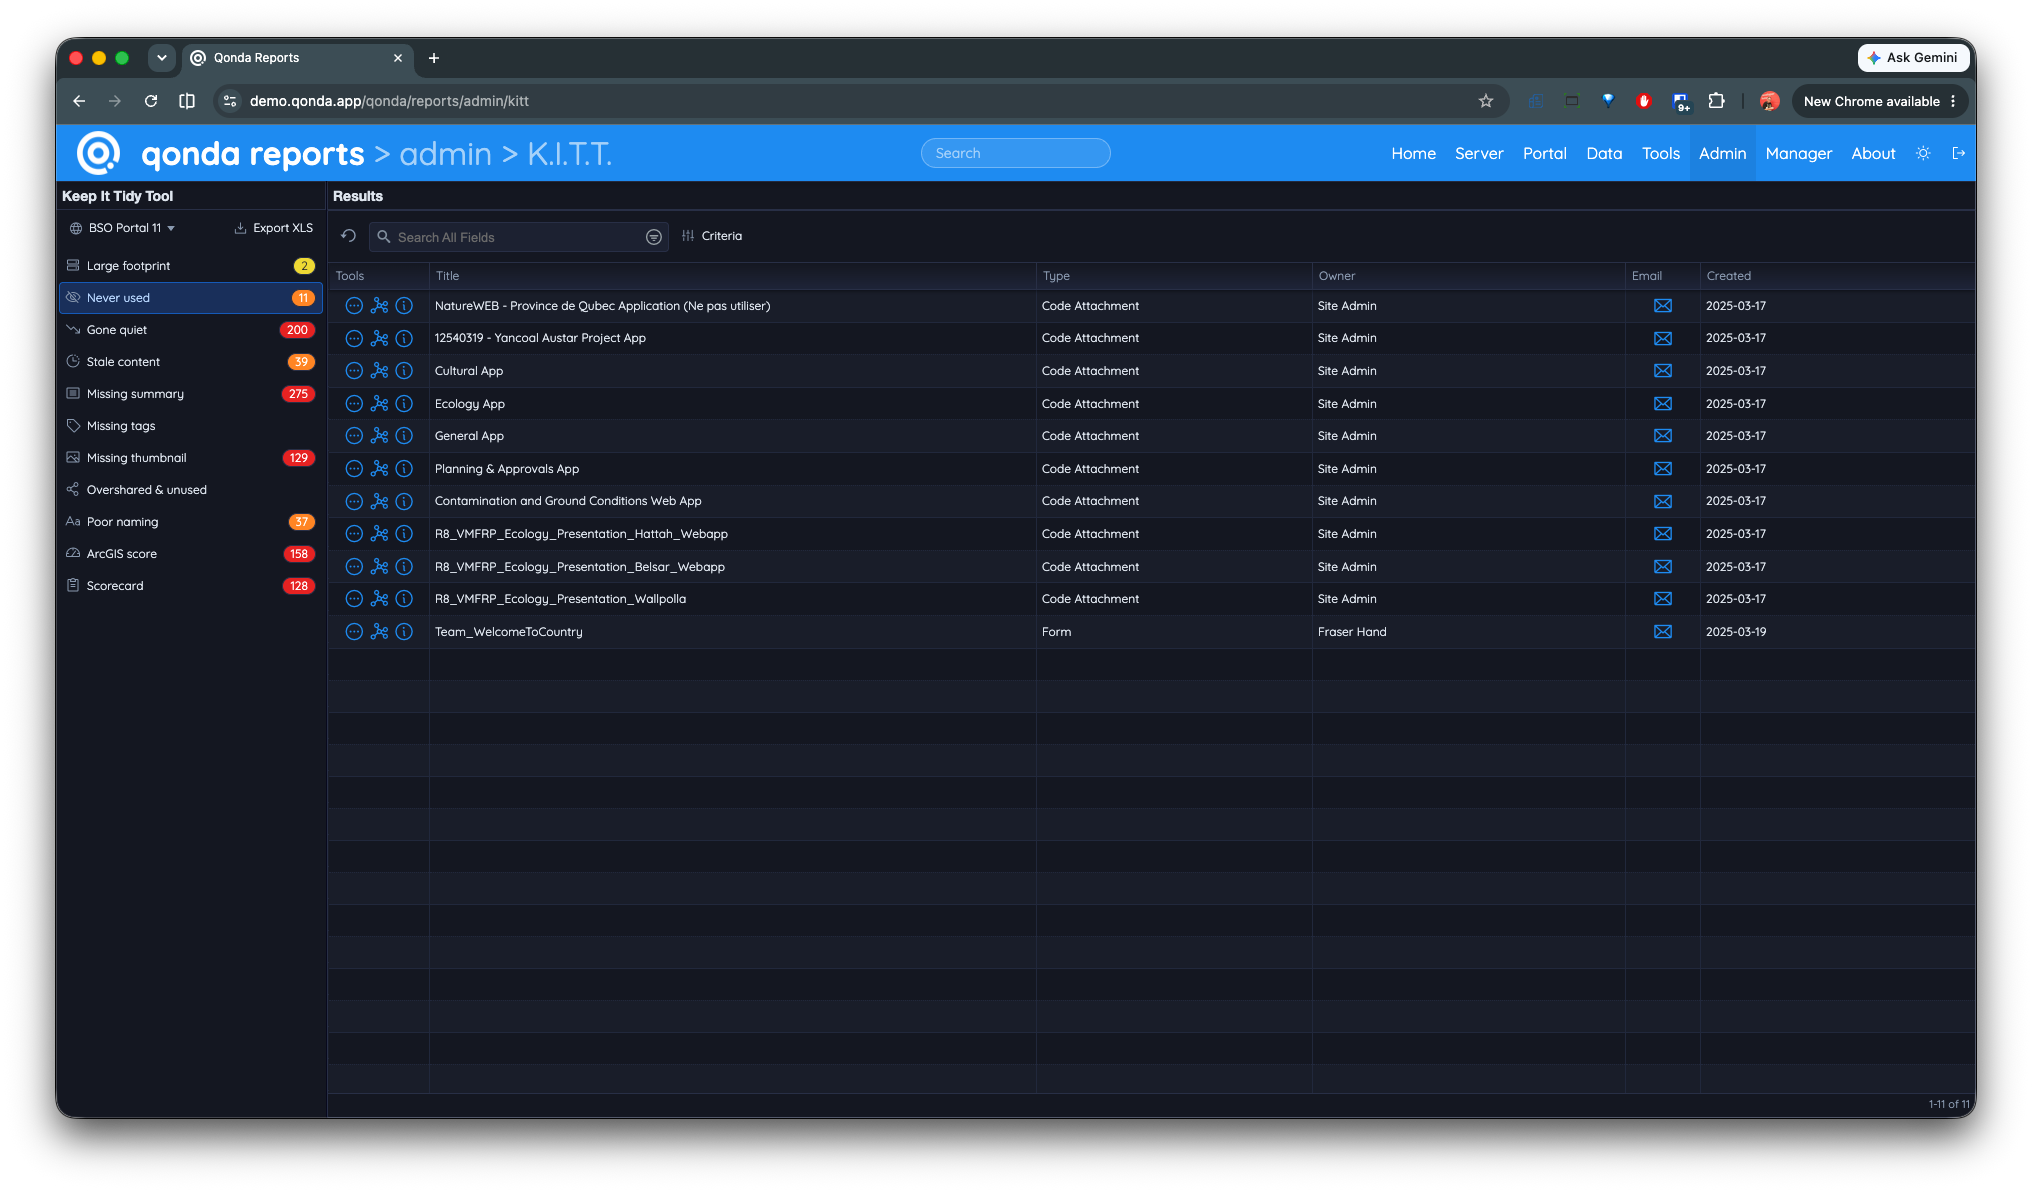
Keep It Tidy Tool
Identify stale, overshared, poorly-described, or oversized items across your catalogue - then notify
content owners by email in one operation, directly from the server.
Data Catalog Export
Export ArcGIS Server metadata directly to Informatica Cloud Data Governance & Catalog or Collibra Data
Catalog - no custom scripting required.